
FIGURE
Fig. 2
- ID
- ZDB-FIG-130919-3
- Publication
- Chapman et al., 2013 - Axonal Transport Defects in a Mitofusin 2 Loss of Function Model of Charcot-Marie-Tooth Disease in Zebrafish
- Other Figures
- All Figure Page
- Back to All Figure Page
Fig. 2
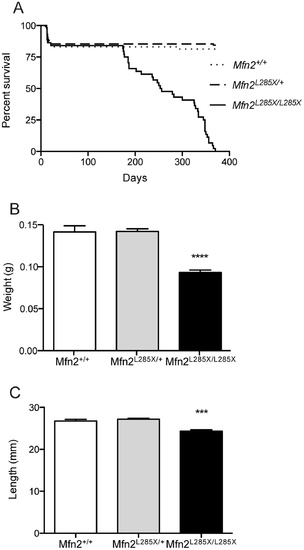
Characterisation of the phenotype of adult MFN2L285X mutant zebrafish.(A) Survival curve showing loss of viability of MFN2L285X/L285X zebrafish from 170 days onwards (p<0.0001, Log-rank (Mantel-Cox) test). (B) Bar graph of body weight for all three groups of siblings at 60–70 days old (p<0.0001, Kruskal-Wallis with Dunn’s multiple comparisons test). (C) Bar graph of the nose to tail length of MFN2L285X mutant and sibling zebrafish at 60–70 days old (p<0.001, Kruskal-Wallis with Dunn’s multiple comparisons test). |
Expression Data
Expression Detail
Antibody Labeling
Phenotype Data
| Fish: | |
|---|---|
| Observed In: | |
| Stage Range: | Days 45-89 to Adult |
Phenotype Detail
Acknowledgments
This image is the copyrighted work of the attributed author or publisher, and
ZFIN has permission only to display this image to its users.
Additional permissions should be obtained from the applicable author or publisher of the image.
Full text @ PLoS One