
Fig. 5
- ID
- ZDB-FIG-130826-53
- Publication
- Chapman et al., 2013 - Axonal Transport Defects in a Mitofusin 2 Loss of Function Model of Charcot-Marie-Tooth Disease in Zebrafish
- Other Figures
- All Figure Page
- Back to All Figure Page
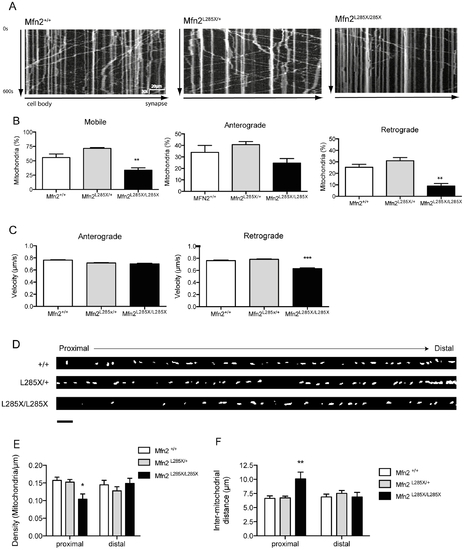
Analysis of axonal transport of mitochondria. (A) Representative kymographs showing defective axonal transport of mitochondria along axons of cultured zebrafish neurons from MFN2L285X/L285X embryos compared with MFN2+/+ and MFN2L285X/+ neurons. (B) Mitochondria in cultured MFN2L285X/L285X neurons are significantly less motile; anterograde displacement of mitochondria is not significantly altered, but retrograde displacement is significantly reduced (p<0.01, one-way ANOVA). (C) The velocity of retrograde but not anterograde mitochondrial transport is significantly reduced in cultured MFN2L285X/L285X neurons (p<0.001, Kruskal-Wallis with Dunn’s multiple comparisons test). (D) Representative images of axons from neurons of each genotype. The cell body is to the left, and distal axon is to the right hand side (scale bar = 10 μm) (E) Comparison of mitochondrial density in proximal and distal axonal segments, there is a significant reduction in mitochondrial density in the proximal but not distal segment of MFN2L285X/L285X neurons (p<0.05, 2-way ANOVA with Bonferroni’s multiple comparisons test). (F) There is a significant increase in the inter-mitochondrial distance in the proximal axon of MFN2L285X/L285X neurons (p<0.01, 2-way ANOVA with Bonferroni’s multiple comparisons test). |
| Fish: | |
|---|---|
| Observed In: | |
| Stage: | Prim-5 |