
Fig. 1
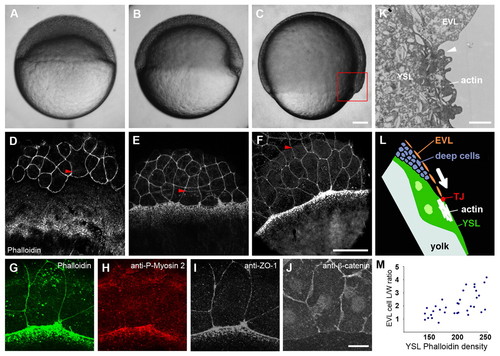
Actin, myosin 2 and ZO-1 become enriched at the EVL-YSL interface. (A-F) Wild-type embryos at dome (A,D), shield (B,E) and 75% epiboly stages (C,F) as bright-field images (A-C) and stained with Phalloidin (F-actin) (D-F). Arrowheads indicate the position of the advancing margin of the deep cells. All zebrafish embryos in these and subsequent panels are displayed with the animal pole at the top unless otherwise indicated. (G-J) Co-staining of the EVL-YSL interface at 75% epiboly with Phalloidin and antibodies against phospho-myosin light chain 2 and ZO-1 (G-I), and single-staining against β-catenin (J). (K) Transmission electron microscopy image of a cross-section through the EVL and YSL at 75% epiboly. Arrowhead points at the EVL-YSL contact. (L) Schematic representation of the boxed region in C, showing the basic organization of the embryonic cell layers. The blastoderm consists of the EVL and deep cell layers and is in contact with the underlying YSL, the surface of the yolk cell. The arrow indicates the movement direction of the blastoderm during epiboly. (M) Relationship between the length/width ratio of individual marginal EVL cells and local Phalloidin signal intensity in the adjacent YSL at 75% epiboly. The values of 34 cells from 6 embryos were plotted. Abbreviations: EVL, enveloping layer; TJ, tight junction; YSL, yolk syncytial layer. Scale bars: in C, 100 μm for A-C; in F, 50 μm for D-F; in J, 25 μm for G-J; in K, 2 μm. |