
- Title
-
Benefits and Toxicity of Disulfiram in Preclinical Models of Nephropathic Cystinosis
- Authors
- Taranta, A., Elmonem, M.A., Bellomo, F., De Leo, E., Boenzi, S., Janssen, M.J., Jamalpoor, A., Cairoli, S., Pastore, A., De Stefanis, C., Colucci, M., Rega, L.R., Giovannoni, I., Francalanci, P., van den Heuvel, L.P., Dionisi-Vici, C., Goffredo, B.M., Masereeuw, R., Levtchenko, E., Emma, F.
- Source
- Full text @ Cells

MS/MS determination of DSF, cystine and mixed-disulfides. (A) Chemical structures of DSF and diethyldithiocarbamate (DDC). The chromatogram shows peaks corresponding to DSF (a), half molecule of DSF (a1) and two molecules obtained by breaking the carbon-sulfur bond (a2 and a3). (B) Chemical structures of cystine and cysteine. The chromatogram shows peaks corresponding to cystine (b), half molecule of cystine (b1), and fragments obtained after breaking carbon-sulfur (b2) and carbon–carbon bonds (b3). (C) Mixed disulfides. The chromatogram on the left panel shows a peak indicating the formation of a mixed-disulfide with a calculated mass–charge ratio (m/z) of 269 (c). The right panel shows the product ion scan for the 269 m/z peak, identifying three fragments: the 148 m/z peak corresponds to half molecules of DSF (a1), the 116 m/z peak is produced by thiol-ester bond cleavage of DSF (a3), and the 74 m/z peak corresponds to cystine (b3). |

Cystine-depleting and anti-apoptotic proprieties of DSF. (A) Comparison of dose–response curves. Cystine (CySS) accumulation was measured after treatment for 24 h with the indicated concentrations of DSF and cysteamine in cystinotic ciPTECs. Vertical dashed lines indicate IC50 for DSF (9 µM) and cysteamine (22 µM). Data represent 4 independent experiments. (B) Anti-apoptotic dose response of DSF. The white and blue columns indicate spontaneous or induced apoptosis with Fas-Ligand (Fas-L) and cycloheximide (CHX) in cystinotic ciPTECs, respectively. The green columns indicate the treatment with DSF (0.6–10 µM) in cells exposed to apoptotic stimuli. Data represent 3 independent experiments. * p < 0.005 and ** p < 0.0005 vs. blue column. |

Short-term treatment with high DSF dose. Two-month-old mice were fed on standard or DSF-supplemented diet at an estimated dose of 200 mg/kg of body weight/day. (A) Body weight in animals fed on standard or DSF-supplemented diets for three months. Data are shown as mean ± SEM; n = 9 WT and 4 KO mice; ** p < 0.005, *** p < 0.0005 compared to untreated animals. (B) Cystine content in kidneys, liver, and heart of KO animals sacrificed at 5 months of age (n = 4 mice per group). Values are indicated as mean ± SEM; * p < 0.05 compared to untreated mice. (C) Representative immunohistochemistry images stained with anti-cleaved caspase-3 antibodies in kidneys obtained from WT (a,b) and KO (c,d) mice that were fed on standard (a,c) or DSF-supplemented (b,d) diets. Scale bar: 100 µm. The graph shows the mean cleaved caspase-3 intensity measured on five separate slides per animal (n = 3 mice per group). |

Long-term treatment with low DSF dose. Two-month-old mice were fed on standard or DSF-supplemented diets at an estimated dose of 100 mg/kg/day for 16 months. (A) Body weight; data are shown as mean ± SEM; n = 5 mice per group; * p < 0.05 compared to untreated animals. (B) Kaplan–Meier survival curves in the same animals. |

Effect of DSF on survival in wild-type (WT) and cystinotic (KO) zebrafish embryos and larvae. (A) Survival curves of untreated KO (n = 82) and WT (n = 126) embryos and larvae. (B) Survival curves of WT and KO embryos treated with different DSF concentrations as indicated in the figure legend. All curves are obtained from at least 100 larvae. Survival was monitored for 96 h post-fertilization (hpf). |
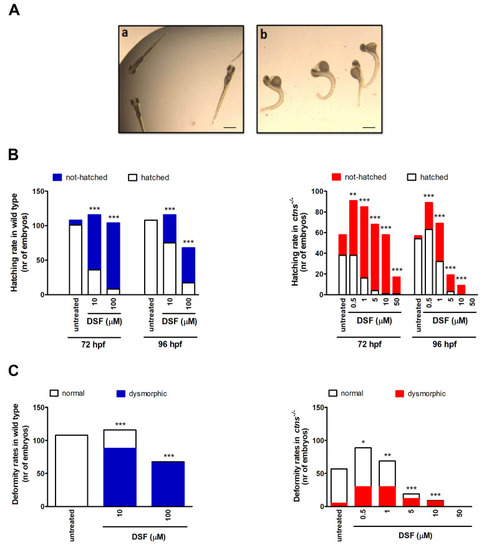
Effect of DSF on hatching and deformity rate in wild-type (WT) and cystinotic (KO) zebrafish embryos and larvae. (A) Representative microscopy image of WT (a) and KO (b) zebrafish embryos. Scale bar: 1 mm. (B,C) Hatching and deformity rates in embryos and larvae treated with different doses of DSF (WT: n = 116 and 104 at 10 and 100 μM, respectively; KO: n = 91, 85, 68, 58, and 17, at 0.5, 1, 5, 10, and 50 μM, respectively). Deformity rates were evaluated after 96 hpf. * p < 0.05, ** p < 0.01, *** p < 0.001 compared to untreated embryos or larvae. PHENOTYPE:
|

A hypothetical model illustrating the effects of DSF in cystinotic cells. DSF (DDC-S-S-DDC) is a disulfide that is reduced to diethyldithiocarbamate (DDC) in the cytosol, consuming GSH and other free thiols. Consequently, cells are more exposed to free radicals, causing oxidative cell damage and death. Similarly to cysteamine, reduced DDC can react with cystine (C-SS-C) in lysosomes, forming a mixed disulfide (DDC-S-S-C) that allows clearance of cystine. |

DSF toxicity in cystinotic cells. (A) Cell viability was measured in healthy and cystinotic ciPTEC after incubation with increasing DSF doses (from 4.5 µM to 1.2 mM). (B,C) The same experiment was repeated after incubation with L-cysteine (1.8 mM) or N-acetyl cysteine (1.8 mM) for 24 h. |

Unillustrated author statements PHENOTYPE:
|