FIGURE

FIGURE 3

ID
ZDB-FIG-220303-46
Publication
Demirci et al., 2022 - Brain Regeneration Resembles Brain Cancer at Its Early Wound Healing Stage and Diverges From Cancer Later at Its Proliferation and Differentiation Stages
Other Figures
All Figure Page
Back to All Figure Page
FIGURE 3

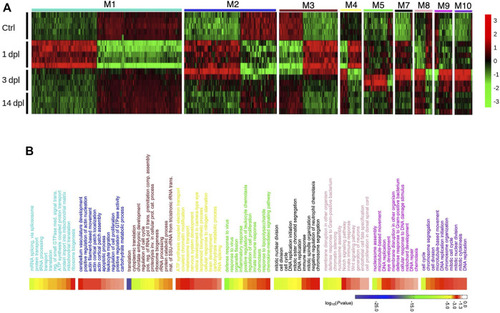
Network analysis of zebrafish brain regeneration at three stages reveals stage-specific modules. (A) Heatmap representing relative expression (z-score) of genes that are enriched in each module for the three stages of the adult zebrafish brain regeneration. Each row represents a sample, and each column shows a single gene. Red and green shades show high or low relative expressions, respectively. (B) DAVID was used to show the most significantly enriched GO-BP terms based on the transcriptional changes of each significant module and their associated enrichment p-values for Top 10 GO-BP terms. The heatmap scale shows log10 of the ease p-values for the most significantly enriched GO terms. dpl: days post-lesion, ctrl: control.

Expression Data

Expression Detail
Antibody Labeling
Phenotype Data

Phenotype Detail
Acknowledgments
This image is the copyrighted work of the attributed author or publisher, and ZFIN has permission only to display this image to its users. Additional permissions should be obtained from the applicable author or publisher of the image. Full text @ Front Cell Dev Biol