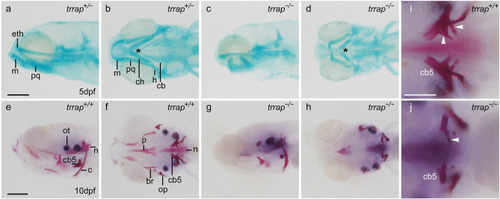
Morphological defects in the pharyngeal arches and teeth of the trrap mutants. (a–d) Alcian blue staining of head cartilage at 5 dpf. (a,b) Wild-type fish (trrap+/−). (c,d) trrap mutants (trrap−/−). (a,c) Lateral view. (b,d) Ventral view. The angle of the paired ceratohyals (indicated with an asterisk) in the trrap mutants was larger than that in the wild-type fish. eth ethmoid plate, m Meckel’s cartilage, pq palatoquadrate, ch ceratohyal, h hyosymplectic, cb ceratobranchials. Scale bar, 200 μm. Genomic DNA was isolated from individual fins, and genotyping of individual larvae was performed by genomic PCR. (e–j) Alizarin red staining of cranial bones at 10 dpf. (e,f,i) Wild-type fish (trrap+/+). (g,h,j) trrap mutant (trrap−/−). (e,g) Lateral view. (f,h–j) Ventral view. The white arrowheads indicate mineralized teeth (i), whereas tooth mineralization was diminished in the trrap mutants (j). ot otolith, n notochord, cb5 ceratobranchial 5, c cleithrum, p parasphenoid, br branchiostegal rays, op opercle. Scale bar, 200 μm (e–h). Scale bar, 100 μm (i,j). Genomic DNA was isolated from individual fins, and genotyping of individual larvae was performed by genomic PCR.
|
