
Fig. 6
- ID
- ZDB-FIG-180720-6
- Publication
- Ji et al., 2018 - Directional selectivity of afferent neurons in zebrafish neuromasts is regulated by Emx2 in presynaptic hair cells
- Other Figures
- All Figure Page
- Back to All Figure Page
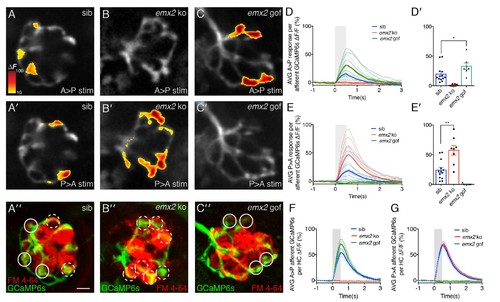
Calcium imaging in afferent process of wildtype and emx2 mutant neuromasts. (A, A’) Representative calcium signals during a A > P (A) and P > A (A’) stimulation in an individual, wildtype sibling afferent process. (B,B’) Afferent calcium signals are detected in emx2 ko mutants in response to P > A (B’), but not in response to A > P (B) stimulation. (C,C’) Afferent calcium signals are only detected in emx2 gof mutants in response to A > P (C), but not in response to P > A (C’) stimulations. (A”,B’’,C’’) The same afferent processes (green) as the panels above, except the HCs are labeled with FM 4–64 (red). (D–E’) Quantification of the mean response per afferent process in wildtype and emx2 mutants. Compared to wildtype, afferent processes in emx2 gof mutants have more signal during A > P stimulation (D, D’), and afferent processes in emx2 ko mutants during P > A stimuli (E, E’), n = a minimum of 7 neuromasts. (F,G) Quantification of the afferent calcium signals per HC. Circular ROIs in A’’, B’’ and C’ show representative ROIs used to quantify calcium signals beneath HCs. Solid and dashed circles represent afferent foci responsive in either the A > P or P > A direction, respectively. For A > P stimuli the average afferent calcium response per HC is not different between wildtype and emx2 gof (F). Similarly, for P > A stimuli, the average afferent calcium response per HC is not different between wildtype and emx2 ko (G). Calcium signals are colorized according to the ∆F heat map and superimposed onto a baseline GCaMP6s image. The number of neuromasts: WT, n = 13; emx2 ko, n = 8; emx2 gof n = 7, obtained from two independent experiments. A one-way ANOVA was used for the comparison in (D’) and (E’). A Kruskal-Wallis test was used for comparisons in (F) and (G), *p<0.05, **p<0.01. Scale bars = 5 μm. |