
Fig. 3
- ID
- ZDB-FIG-180410-43
- Publication
- Sun et al., 2017 - Proximal Tubular Expression Patterns of Megalin and Cubilin in Proteinuric Nephropathies
- Other Figures
- All Figure Page
- Back to All Figure Page
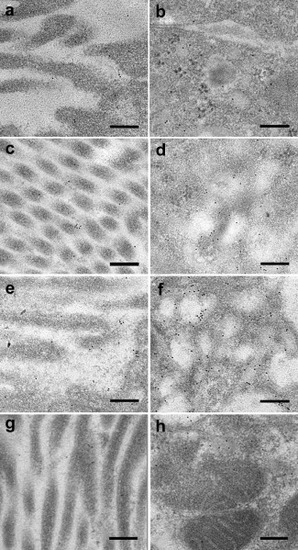
Immunoelectron microscopy images of megalin expression. Images are from IgA nephropathy (IgAN) patients with microalbuminuria (<300 mg/24 hours), macroalbuminuria (>300 mg/24 hours and <3500 mg/24 hours), nephrotic-albuminuria (>3500 mg/24 hours), and controls. The different expression of megalin between the 3 groups is shown in the brush border (left panel) of the proximal tubular cells and in the cytoplasm area (right panel) (original magnification ×39,000). Images (a) and (b) show nephrotic-albuminuric IgAN, (c) and (d) show macroalbuminuric IgAN, (e) and (f) show those with microalbuminuria, and (g) and (h) show controls. Note the increased labeling between the 3 groups. Bar = 200 nm. |