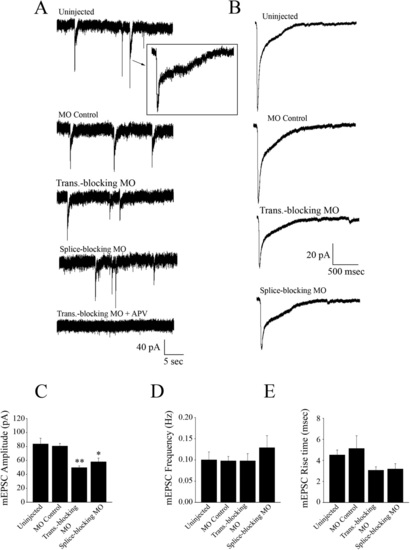
Spontaneous synaptic NMDAR currents obtained from M-cells. (A) Uninjected embryos (n = 7), control morpholino injected embryos (n = 6), translation-blocking morpholino injected embryos (n = 5), and splice-blocking morpholino injected embryos (n = 5) exhibit NMDAR currents at similar frequencies. The inclusion of APV (50 µM) confirmed the mEPSCs as NMDAR-mediated. Inset shows an example of an individual mEPSC on an expanded time scale. Note the biexponential decay phase of the individual event. Preparations were incubated in TTX (1 µm), strychnine (5 µM), picrotoxin (100 µM), and NBQX (0.1 µM) to block action potentials, glycine, GABA and AMPA receptors, respectively. (B) Averaged mEPSCs recorded from M-cells of an uninjected control, a control MO injected embryo and translation-blocking morpholino injected embryo and a splice-blocking morpholino injected embryo. Each trace is an average of multiple events; 86 mEPSCs for the uninjected controls, 44 events for the MO controls, 58 events for the translation-blocking morphants, and 22 events for the splice-blocking morphants. Bar graphs comparing the peak amplitude (C), frequency (D), and 20–80% rise time (E) of averaged NMDA mEPSCs. * Significantly different from uninjected and MO controls, p < 0.05, ** significantly different from uninjected and MO controls, p < 0.01.
|
