
Fig. 5
- ID
- ZDB-FIG-090617-9
- Publication
- Zhou et al., 2009 - Molecular cloning and expression of phospholipase C epsilon 1 in zebrafish
- Other Figures
- All Figure Page
- Back to All Figure Page
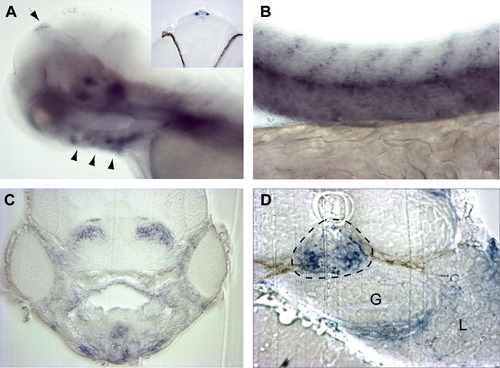
Expression of plce1 at 72 hpf. (A) Lateral view of head showing plce1 expression is restricted to a few groups of cells in the midbrain, a group of cells at the top of the dorsal forebrain (arrow, inset shows the transverse section of the dorsal forebrain) and the branchial cartilages (arrowheads). (B) Lateral view showing expression of plce1 in skeletal muscle persists at 72 hpf. (C) Transverse section showing plce1 expression in two symmetric groups of cell in the midbrain and in the pharyngeal cartilages. (D) Transverse section showing plce1 is expressed in the fused pronephric glomeruli (dashed circle) at the midline and in the liver (L), but absent from the gut (G). |
| Gene: | |
|---|---|
| Fish: | |
| Anatomical Terms: | |
| Stage: | Protruding-mouth |
Reprinted from Gene expression patterns : GEP, 9(5), Zhou, W., and Hildebrandt, F., Molecular cloning and expression of phospholipase C epsilon 1 in zebrafish, 282-288, Copyright (2009) with permission from Elsevier. Full text @ Gene Expr. Patterns