|
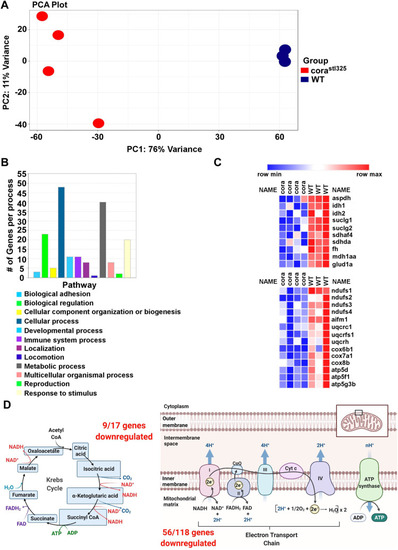
RNA sequencing of control and corastl325 identifies derangements metabolic gene expression. (A) Principal component analysis (PCA) plot of pooled sequencing libraries generated from control and corastl325 embryos at 96 hpf. Each dot represents a pool of 100 embryonic hearts. (B) Bar graph of the top Gene Ontology (GO) pathways associated with genes differentially expressed between control and corastl325 hearts. (C) Heat map of metabolic genes significant with significantly reduced expressed in corastl325 hearts. (D) Graphical representation of the number of differentially expressed metabolic genes associated with the TCA cycle (left) and the electron transport chain (right). Made with BioRender.
|