
- Title
-
Genetic analysis of tissue interactions required for otic placode induction in the zebrafish
- Authors
- Mendonsa, E.S. and Riley, B.B.
- Source
- Full text @ Dev. Biol.
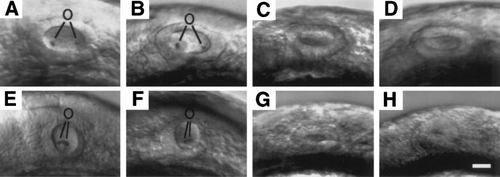
Effects of various mutations on morphology of the otic vesicle. Shown are otic vesicles at 24 h in (A) wild-type, (B) ntl-, (C) oep-, (D) ntl-;oep-, (E) val-, (F) ntl-;val-, (G) oep-;val-, and (H) ntl-;oep-;val- embryos. Where appropriate, otoliths (o) are indicated. Scale bar, 25 μm. |
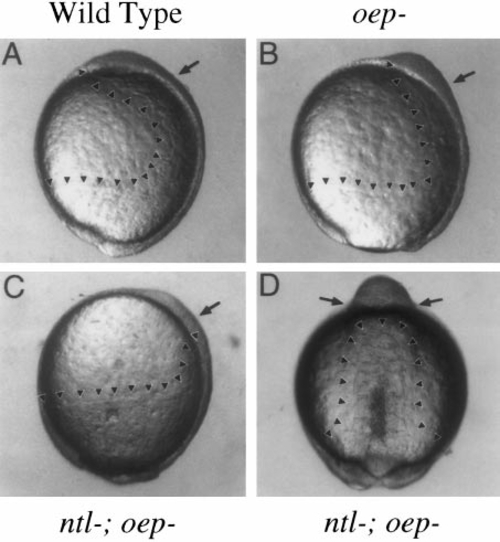
Deficiency of mesendoderm in ntl-; oep- mutant embryos. Wild-type and mutant embryos were observed during gastrulation and neurulation to monitor movements of the hypoblast. Arrowheads mark the leading edges of the hypoblast, and arrows mark the approximate positions of the otic anlage along the anteroposterior axis. (A–C) Lateral views of embryos at 10.5 h, when otic induction normally begins. In wild-type embryos (A), axial hypoblast extends to just past the animal pole. Ventrolateral hypoblast has converged toward the axis, contributing to formation of paraxial mesendoderm. Epiboly is now complete and the tail bud is well formed. In oep- mutants (B), axial hypoblast extends only to the midbrain–hindbrain region, reflecting the deficiency in prechordal plate. Paraxial mesendoderm is clearly evident up to this region. Epiboly is about 95% complete. In ntl-;oep- mutants (C), axial hypoblast extends only to the anterior trunk region, and paraxial hypoblast is greatly reduced. At this time, there is essentially no hypoblast in the vicinity of the otic anlage. Epiboly is only 90% complete. From the lateral perspective, hypoblast movements appear normal in ntl- embryos (not shown). (D) Dorsal view of a ntl-;oep- double mutant at 13.5 h, around the time when otic induction begins in such embryos. The hypoblast forms a column of tissue that extends along the dorsal midline up to the anterior trunk region and gives rise to rudimentary somites. No hypoblast is evident anterior to the somites. Somites continue to mark the anterior limit of the mesoderm through at least 16 h, after which morphology becomes too disturbed to clearly resolve internal tissues (not shown). Necrosis of mesodermal tissues is variable, but often becomes evident during segmentation, as can be seen along the posterior midline of this specimen. The animal pole is oriented upward in all panels, and dorsal is to the right in A–C. |
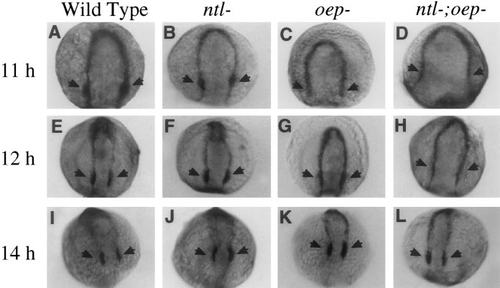
Effects of mesendoderm deficiencies on expression of dlx-3. Shown are expression patterns of dlx-3 at (A–D) 11 h, (E–H) 12 h, and (I–L) 14 h. Otic regions (arrows) express high levels of dlx-3 at all of the time points shown in wild-type (A, E, I) and ntl- (B, F, J) embryos. In contrast, upregulation of dlx-3 in the otic regions is delayed in oep- embryos (C, G, K), which are deficient in prechordal mesoderm. The delay is even greater in ntl-;oep- embryos (D, H, L), which are deficient in virtually all cephalic mesendoderm. |
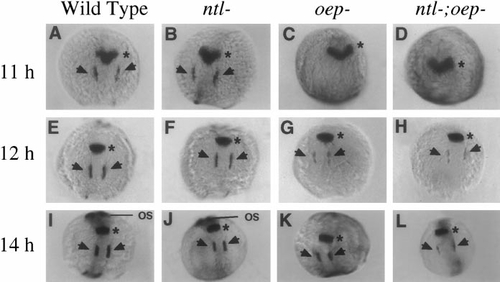
Effects of mesendoderm deficiencies on expression of pax-2.1. Shown are expression patterns of pax-2.1 at (A–D) 11 h, (E–H) 12 h, and (I–L) 14 h. In wild-type (A, E, I) and ntl- (B, F, J) embryos, pax-2.1 is expressed in the primordia of the midbrain–hindbrain border (asterisks) and otic regions (arrows) from 11 h onward, and expression is greatly upregulated in the optic stalks (os) by 14 h. In oep- (C, G, K) and ntl-;oep- embryos (D, H, L), pax-2.1 is expressed normally in the primordium of the midbrain–hindbrain border, but expression in the otic regions is delayed, and staining is not detected in the optic stalks due to disruption of eye development in embryos lacking oep function. |
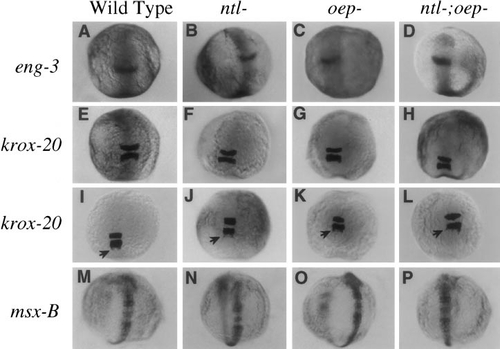
Anteroposterior patterning of the neural plate is normal in mesendoderm-deficient mutants. Shown are expression patterns of (A–D) eng-3 at 11 h, krox-20 at (E–H) 12 h and (I–L) 14 h, and (M–P) msx-B at 14 h. Expression patterns of all of these genes are comparable in wild-type (A, E, I, M), ntl- (B, F, J, N), oep- (C, G, K, O), and ntl-;oep- (D, H, L, P) embryos. Arrows in I–L show streams of neural crest cells migrating caudally from rhombomere 5. |
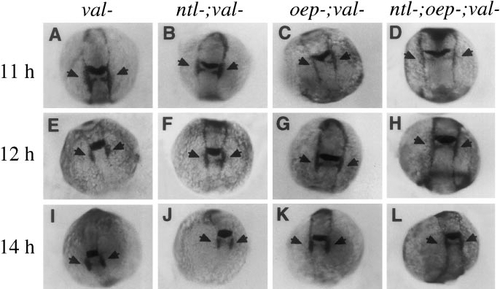
Disruption of hindbrain development in val- embryos does not further delay expression of dlx-3. Shown are expression patterns of both dlx-3 and krox-20 at (A–D) 11 h, (E–H) 12 h, and (I–L) 14 h. Although embryos lacking val function cannot be morphologically distinguished at the early developmental stages examined here, val- embryos were identified unambiguously by virtue of their low levels of krox-20 expression in rhombomere 5. Expression of dlx-3 is normal in val- (A, E, I) and ntl-;val- embryos (B, F, J). Upregulation of dlx-3 in the otic regions (arrows) in oep-;val- (C, G, K) and ntl-;oep-;val- embryos (D, H, L) is delayed to roughly the same extent as in oep- and ntl-;oep- embryos with normal val function (see Fig. 3). |
Reprinted from Developmental Biology, 206, Mendonsa, E.S. and Riley, B.B., Genetic analysis of tissue interactions required for otic placode induction in the zebrafish, 100-112, Copyright (1999) with permission from Elsevier. Full text @ Dev. Biol.