
- Title
-
Expression of zebrafish bHLH genes ngn1 and nrd defines distinct stages of neural differentiation
- Authors
- Korzh, V., Sleptsova, I., Liao, J., He, J.Y., and Gong, Z.
- Source
- Full text @ Dev. Dyn.
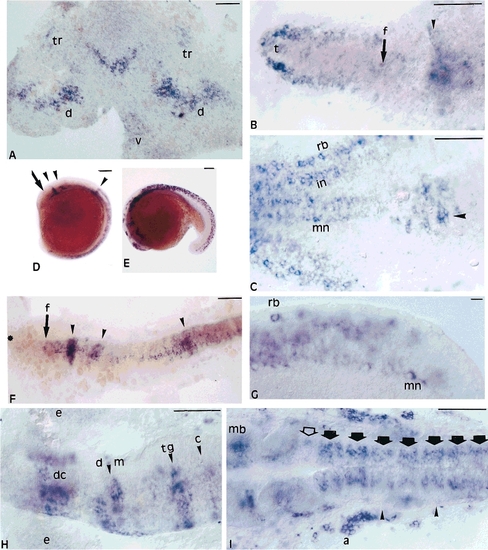
Expression of zebrafish ngn1 during early development. Initially, expression is confined to six major domains, including paired domains contributing to the trigeminal ganglia and the dorsal spinal cord as well as the midbrain-hindbrain boundary (MHB) and the ventral part of the spinal cord. Later in development this pattern resolves in finer detail, allowing the description of specific ngn1-positive cell lineages. Anterior is toward the left, except in A, where anterior is up. A: 8.5 hours postfertilization (hpf); dorsal view of a neural plate after the yolk has been removed. B: 12 hpf; dorsal view of the anterior neural plate; arrowhead, cells spanning the dorso-ventral axis of the neural plate. C: 12 hpf; dorsal view of the posterior neural plate; arrowhead, cells expressing ngn1 close to the caudal end of the notochord. D: 15 hpf; side view. F: 15 hpf; dorsal view; arrowheads indicate the position of a border-like group of cells; arrow, the anterior extent of the floor plate; asterisk in F, the anterior extent of the neural plate. Note the lack of ngn1 transcripts in the telencephalon. E: 20 hpf; side view, G: 20 hpf; side view in the tail region; H: 20 hpf; dorsal view in the head (the embryo is slightly tilted to the left). I: 24 hpf; large open arrowhead, rhombomere 1; large arrowhead, rhombomeres; small arrowheads define the left otic vesicle, a, acoustic ganglion; c, cerebellum; d, dorsal spinal cord; dc, diencephalon; d m, diencephalic-midbrain border; e, eye; f, the position of the anterior extent of the floor plate; in, interneurons, mb, midbrain; mn, motoneurons; rb, Rohon-Beard cells; v, ventral spinal cord; t, telencephalon; tg, tegmentum; tr, trigeminal ganglion. Scale bars = 100 μm in A–F,H; 10 μm in G. EXPRESSION / LABELING:
|
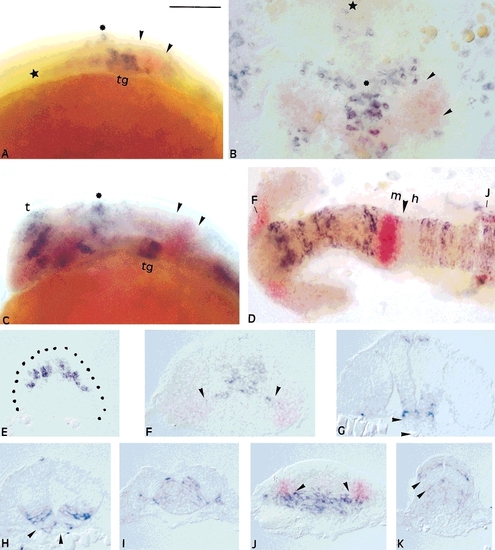
Expression of ngn1 and pax-b during formation of the zebrafish CNS is specific and mutually exclusive. Note the gaps in expression of ngn1 in G,H,K illustrating the layered organization of the neural tube. Small arrowheads define the borders of pax-b expression at the midbrain-hindbrain boundary; the large arrowhead defines the posterior boundary of the midbrain. Asterisks, the dorsal expansion of ngn1 cells; stars, the anterior extent of the floor plate. F,J: Defines positions of cross-sections shown on F and J. A,B,C,D,F,J show two color in situ hybridization: pax-b, magenta, ngn1, blue. E-K: cross-sections; A,C,D: anterior to the left; B: anterior to the top. A,B: 10.5 hpf; C,D: 18 hpf. C,D,F,J: same embryo at 18 hours postfertilization (hpf). E,G,H,I,K: 24 hpf. Scale bar = 100 μm. |
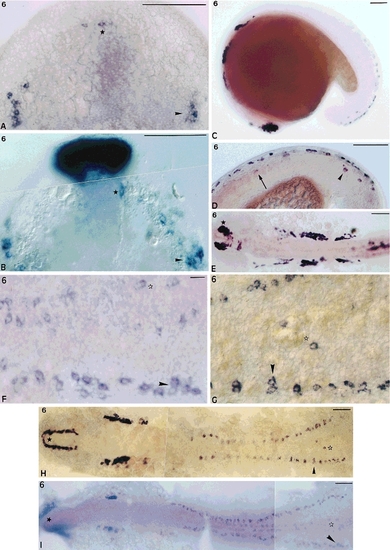
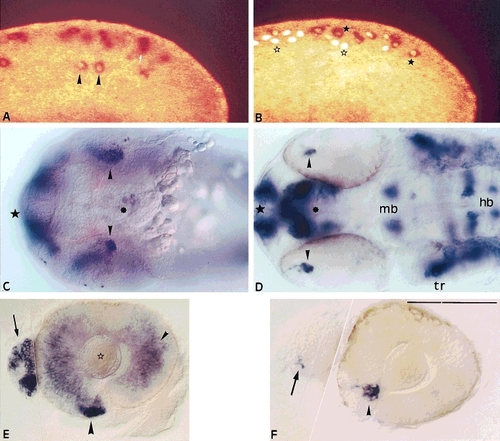
nrd expression detected by whole-mount in situ hybridization. In Aand B the embryos are positioned such that the anterior end is up, and in all other cases the anterior end is to the left. A: nrd expression in the 10 hours postfertilization (hpf)-embryo, dorsal view of the rostral part of the neural plate. Arrowhead, trigeminal ganglia; star, brain cells. B: islet-1 expression in the rostral part of the neural plate, stage 10 hpf, top view. Arrowhead, trigeminal ganglia; star, brain cells. C: nrd expression in the 17-hpf embryo, side view. D: nrd expression in the caudal region of the 17-hpf zebrafish embryo, side view. Caudal MNs, arrowhead; more rostral MNs, arrow. E: nrd expression in the rostral part of the 22-hpf zebrafish embryo, dorsal view. Asterisk, telencephalon. H: nrd expression in the 12-hpf spread zebrafish embryo, dorsal view. Star, telencephalon; arrowhead, Rohon-Beard cells; open star, motoneurons. G: Arrowhead and open star define same cells as in H. I: islet-1 expression in the 12 hpf spread zebrafish embryo, dorsal view. Star, telencephalon; arrowhead, Rohon-Beard cells; open star, motoneurons. F: Blowup, arrowhead and open star define same cells as in I. Scale bars = 100 μm in A-E,H,I, 10 μm in F,G. EXPRESSION / LABELING:
|
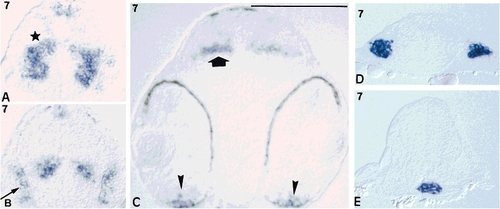
Analysis of nrd expression in cross-sections reveals a selective pattern confined to specific cell lineages. A: 36 hours postfertilization (hpf), anterior forebrain; star, staining in the telencephalic area. B: 36 hpf; arrow, olfactory placode. C: 36 hpf; arrow, ventral retina; arrowheads, optic tectum. D: 24 hpf; hindbrain, staining in acoustic ganglia. E: 24 hpf; anterior spinal cord, ventral staining in the developing pancreas. Scale bar = 100 μm. |
nrd and Islet-1 are coexpressed in several cell lineages in the embryonic zebrafish. Bar – 100μm. A, B: nrd mRNA and Islet-1 are often localized within the same cells in the 17 hpf embryos. Embryos were stained by whole mount in situ hybridization for nrd (dark staining of the cytoplasm with alkaline phosphatase) and by whole mount immunohistochemistry for Islet-1 (fluorescence detects fluorescein in the cell nuclei). A: an optical section on the level of MN. nrd expression in RB cells is seen as dark spots in the dorsal part of the spinal cord - white arrow. Islet-1 staining in MN is shadowed by the dark product of alkaline phosphatase - arrowheads. B: an optical section on the level of RB cells. There are two populations of Islet-1 - positive cells in the dorsal spinal cord. The first cell population coexpresses nrd and Islet-1. Islet-1 fluorescent signals are shadowed by the dark product of alkaline phosphatase used to detect nrd (filled stars). The second cell population is characterized by bright Islet-1-coupled fluorescence. There are no detectable nrd transcripts in these cells (open stars). Note that RB cells of both populations can be located on the same A-P level, suggesting that nrd expression could be more limited compared to that of Islet-1. C: nrd expression at 33 hpf, ventral view. Star - telencephalon and olfactory placode, arrowheads - ventral retina, asterisk- ventral forebrain. D: islet-1 expression at 36 hpf, star - telencephalon and olfactory placode, arrowheads - retina, asterisk-ventral forebrain; mb - midbrain; hb - hindbrain; tg - trigeminal ganglia. E: an isolated eye at 33 hpf after hybridisation with nrd. Note nrd staining in the ventral retina (arrowheads) and olfactory placode (arrow). F: an isolated eye at 33 hpf after hybridisation with islet-1. Note islet-1 transcripts in the retina and olfactory placode. E, F: photomontage presents olfactory placode connected to the anterior portion of the eye. EXPRESSION / LABELING:
|

Unillustrated author statements |