- Title
-
The effect of pertussis toxin on zebrafish development: a possible role for inhibitory G-proteins in hedgehog signaling
- Authors
- Hammerschmidt, M. and McMahon, A.P.
- Source
- Full text @ Dev. Biol.
|
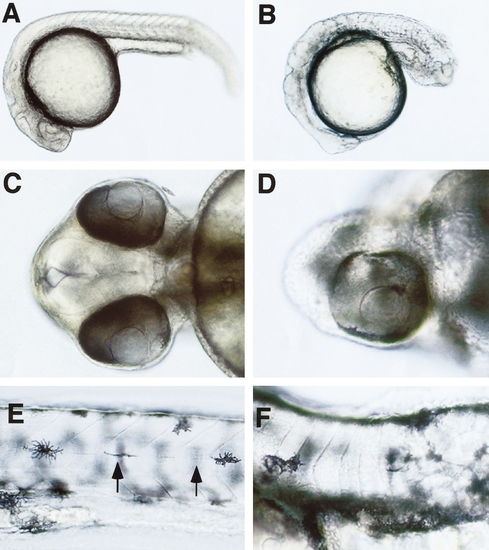
Morphology of Ptx-injected embryos. (A, C, E) uninjected control, (B, D, F) Ptx-injected. (A, B) 30 hpf, lateral view; the injected embryo displays an altered shape of the head, blocky somites, and a generally disorganized tail. (C, D) 72 hpf, ventral view on head; the injected embryo displays cyclopia. (E, F) 96 hpf, lateral view on somites in trunk at level of anus; the somites of the injected embryo lack the chevron shape and the horizontal myoseptum (indicated in E by arrows). hpf, hours after fertilization. |
|
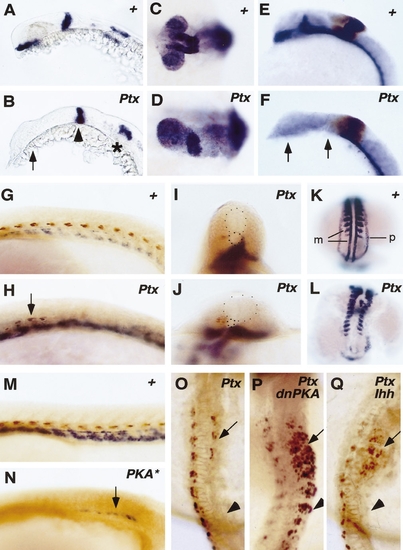
Altered gene expression after injection of Ptx (B, D, F, H–J, L, O), PKA* (N), and the coinjection of Ptx and dnPKA (P) and Ptx and Ihh RNA (Q). “+” indicates uninjected controls. (A, B) pax2, 30 hpf, lateral view on head; in B, the pax2 expression in the optic stalk region is absent (indicated by arrow), while expression in the midbrain–hindbrain boundary and otic placodes is unaffected (indicated by arrowhead and asterisk, respectively). (C, D) pax6, 30 hpf, dorsal view on head. (E, F) shh (blue) and eng (brown); 30 hpf; in F, shh expression is absent in ventral regions of fore- and midbrain (indicated by arrows). (G–J) twi (blue) and eng (brown), 20 hpf; (G, H) lateral view on somites 1–12, (I, J) optical section through trunk somite of two embryos with unilateral effects; in H, eng expression is missing in the posterior somites, but unaffected in somites 1–4 (indicated by arrow), while twi expression is stronger; in I and J, the affected right side of the embryos displays an expansion of twi expression into adaxial regions which lack eng expression. Notochord and neural tube are outlined. (K, L) myoD (marked with ‘‘m’’) and pax2 (marked with ‘‘p’’), 15-somite stage, dorsal view on trunk; in L, the adaxial myoD stripes are absent, while myoD expression in lateral regions of the somites is unaffected. (M, N) twi (blue) and eng (brown), 20 hpf, lateral view on somites 1–12; in N, eng expression is completely abolished in all somites, while twi expression (indicated by arrow) is strongly reduced. (O–Q) eng expression; 20 hpf, dorsal view on somites 1–12, effect on right side; somites 1–5 are indicated by an arrow, more posterior somites by an arrowhead; in P, all somites display an increase in the number of eng-positive cells, whereas in Q an increase is only seen in somites 1–5 (indicated by arrow), while more posterior somites lack eng-positive cells as in O. |
Reprinted from Developmental Biology, 194, Hammerschmidt, M. and McMahon, A.P., The effect of pertussis toxin on zebrafish development: a possible role for inhibitory G-proteins in hedgehog signaling, 166-171, Copyright (1998) with permission from Elsevier. Full text @ Dev. Biol.


