
- Title
-
Differential regulation of chordin expression domains in mutant zebrafish
- Authors
- Miller-Bertoglio, V.E., Fisher, S., Sanchez, A., Mullins, M.C., and Halpern, M.
- Source
- Full text @ Dev. Biol.
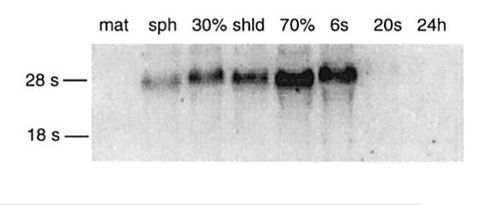
Sequence conservation and expression of zebrafish chordin. (A) The alignment compares the amino acid sequence of zebrafish Chordin with Xenopus Chordin and Drosophila Short gastrulation. Stars and dots indicate identical amino acids and conservative amino acid substitutions, respectively. Cysteine-rich repeats are outlined in boxes and the region corresponding to the CR1 PCR amplification product is shown in gray. (B) The numbers indicate the percentages of amino acid identity within and outside the CR repeats (shaded) in the three proteins (proteins are not drawn to scale). (C) Northern blot analysis demonstrates that a single chordin transcript is present at low lowels in the late blastula, increases during gastrulation, and persists through early somitogenesis. RNA was collected from embryos prior to midblastula transition (mat) and at sphere stage (sph), 30% epiboly (30%), 50% epiboly (shld), 70% epiboly (70%), 6 somites (6s), 20 somites (20s), and 24 h postfertilization (24h). For this blot, the probe was a HinfII restriction fragment (601) bp) that included CR3 and CR4 |
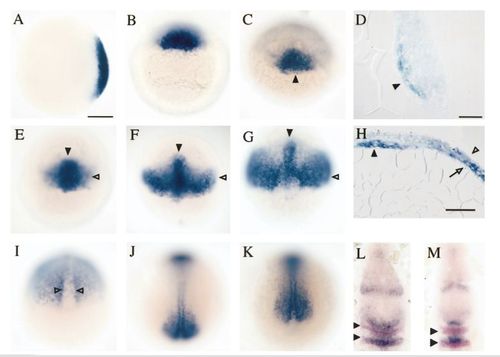
Dynamic expression of chordin in the developing zebrafish. (A, B) Zebrafish chordin was detected at the future dorsal side of the late blastula (sphere stage: A, animal pole view; B, dorsal view). (C, D) By early gastrulation, expression was confined to deep cells in the embryonic shield (arrowhead). D is a sagittal section through the shield at 50% epiboly. (E – H) As gastrulation proceeded, expression was found transiently in the axis (arrowhead) and new bilateral domains of expression appeared (open arrowhead) in all superficial (ectoderm) and deep (mesoderm) cell layers, except the layer closest to the yolk (open arrow, H). E is shield stage at 50% epiboly, F is 30 min after E, and G and H are at 70% epiboly. H is a transverse section through the axis and flanking regions. (I – K) In late gastrulae, chordin was expressed in cells adjacent to the notochord and downregulated in the axis (open arrowheads). Bilateral expression domains persisted in the most posterior region only. I is at 90% epiboly and J and K are at 100% epiboly. (L, M) At late gastrulation, chordin was also expressed in discrete domains in the forebrain, midbrain, and hindbrain (in blue). Double labeling with a probe for krox-20, which is expressed in rhombomeres 3 and 5 (in pink), indicated that chordin expression in the hindbrain is very dynamic, present in different rhombomeres over time. Scale bars = 150 μm (A – C, E – G, and I – M), 25 μm (D), and 50 μm (H). EXPRESSION / LABELING:
|
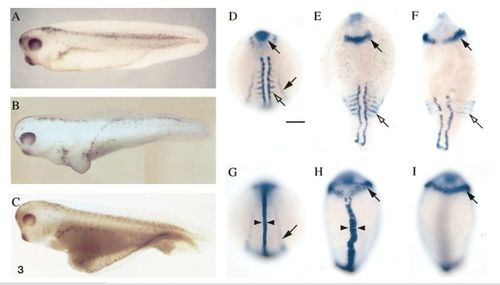
Dorsalizing activity of zebrafish Chordin in Xenopus and zebrafish embryos. (A) Uninjected Xenopus embryo (stage 37/38); (B) Xenopus embryo coinjected with 10 nl of zebrafish chordin and GFP RNA (20 ng/μl) on the ventral side at the two-cell stage; (C) Xenopus embryo coinjected ventrally at the one-cell stage with 5 nl of zebrafish chordin and GFP RNA (20 ng/μl). (D – I) In situ hybridization using pax2 and myoD probes (D – F) or pax2 and ntl probes (G – I) of uninjected zebrafish embryos (D and G) or embryos injected with chordin RNA (E, F, H, and I) at the one- to four-cell stage during segmentation. All injected embryos shown correspond to class d of Table 2. (E, F) Severely dorsalized embryos were characterized by their elongated shape, laterally expanded domain of pax2 expression at the midbrain – hindbrain junction (arrow), and ventrally extending somites (open arrows). (H) In some injected embryos, the ntl expression domain (arrowheads) in the notochord was widened relative to controls (G). D – H are dorsal views. (I) A ventral view of the same embryo as H shows the expansion of pax2 expression in the brain around the entire circumference of the embryo (arrow). Pronephric duct expression of pax2 (arrow, G) was often missing in injected embryos. |
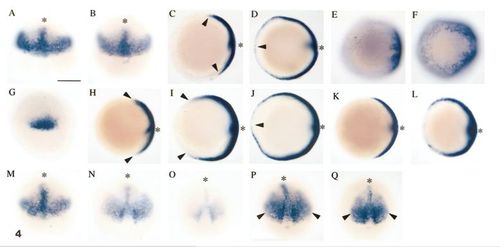
Altered dorsolateral chordin expression domains in dorsalized and ventralized zebrafish mutants. (A – F) Expression of chordin in dorsalized swr mutants (B, D, F) was expanded ventrally (arrowheads) compared to WT sibs (A, C, E). A and B are animal pole views and C and D are dorsal views at 75% epiboly. E and F are vegetal pole views at 90% epiboly. (G) At shield stage, dorsal organizer expression of chordin was indistinguishable in sbn mutants and WT siblings (dorsal view) and in embryos from intercrosses of all other dorsalizing mutations examined (not shown). (H – L) Animal pole views. Expression was ventrally expanded (arrowheads) compared to WT (H, K) in both sbn (I and J) and snh (L) mutants at 75% epiboly. As described in the text, all embryos from sbn intercrosses had altered expression patterns which fell into two classes (I was the pattern of two-thirds and J was the pattern of one-third of embryos). (M – Q) Dorsal views. (M) chordin expression was indistinguishable in weakly ventralized mes mutants and WT siblings at 75% epiboly. (N, O) However, expression was decreased overall in ventralized ogo mutant embryos (O) compared to WT sibs (N) at 90% epiboly. (P, Q) Dorsolateral domains of chordin expression (arrowheads) were also more dorsally restricted in stl mutants (Q) compared to WT siblings (P) at 80% epiboly. Asterisks indicate the dorsal midline. Scale bar = 20 μm. EXPRESSION / LABELING:
|
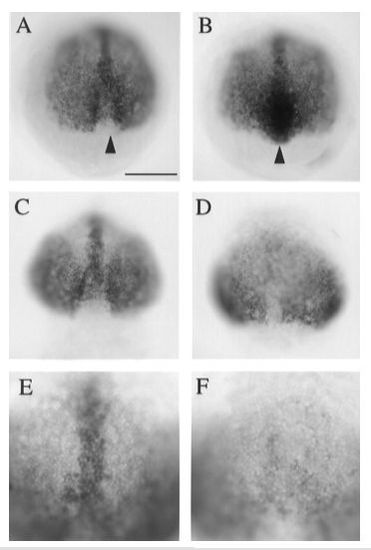
Domains of chordin expression are selectively affected in flh and spt mutants. (A, B) At 90% epiboly, chordin expression decreases in the posterior midline of WT embryos (A), but is increased in this region in flh mutants (B). (C – F) At 80% epiboly, chordin expression is not maintained in the axis of spt mutant embryos (D, F), compared to WT sibs (C, E). Scale bar 20 μm for A – D and 40 μm for E and F. EXPRESSION / LABELING:
|
Reprinted from Developmental Biology, 192, Miller-Bertoglio, V.E., Fisher, S., Sanchez, A., Mullins, M.C., and Halpern, M., Differential regulation of chordin expression domains in mutant zebrafish, 537-550, Copyright (1997) with permission from Elsevier. Full text @ Dev. Biol.