
- Title
-
Loss of cerebum function ventralizes the zebrafish embryo
- Authors
- Fisher, S., Amacher, S.L., and Halpern, M.E.
- Source
- Full text @ Development
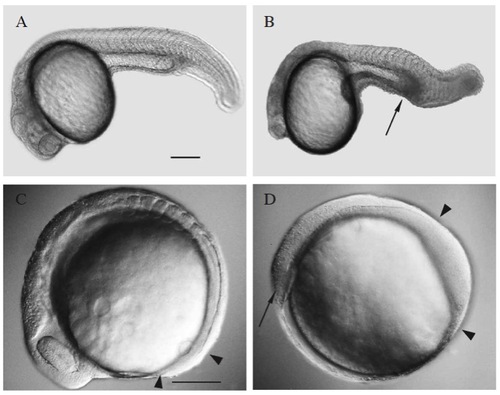
Pleiotropic action of cerebum deficiencies on zebrafish development. (A) WT diploid pharyngula and (B) crmc4 mutant sibling at the 26 somite stage. The crm mutant is characterized by a reduced brain and eyes, and an abnormal accumulation of cells caudal to the anus (arrow). (C) WT embryo and (D) crmc4 sibling at the 8 somite stage. The mutant exhibits a shorter axis, a shallower anterior neural keel (arrow), and an enlarged tailbud (arrowheads). Scale bars, 200 μm. PHENOTYPE:
|
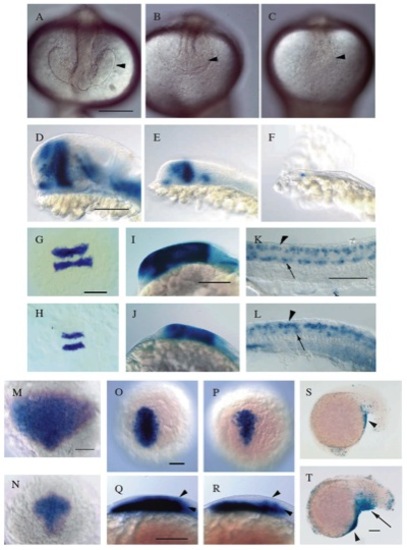
(A-F) CNS phenotype of crm alleles. Anterior nervous system of (A) WT, (B)crmb305 and (C) crmb409 diploid embryos [20 somite stage]. Note the reduced size of the optic vesicles (arrowheads) in crmb305 and their absence in crmb409 homozygotes. Expression in (D) WT, (E) crmb305 and (F) crmb409 of lim5 [24 hours]. (A-C) Frontal views, with dorsal to the top; (D-F) side views, with anterior to the left. (G-L) Polarity is retained in crm mutant CNS. (G) WT and (H) crmb305 mutant krox-20 expression at 4-6 somites. (I) WT and (J) crmb305 mutant otx1 expression at 20 somites. (K) WT and (L) crmc4 mutant isl1 expression in trunk spinal cord at 24 hours. Dorsal Rohon-Beard sensory neurons (arrowheads) and ventral primary motor neurons (arrows) express isl1 (Korzh, et al., 1993; Inoue, et al., 1994). G and H are dorsal views, with anterior to the top; I-L are side views with anterior to the left. M-R: Markers of neurectoderm are reduced in crm- gastrula. (M) WT and (N) crmc4 mutant expression of otx2 at 80% epiboly. (O, P) Expression of gsc [80% epiboly] in WT (O) and crmc4 mutant (P). (Q,R) Side view of gsc expression at same stage, in WT (Q) and mutant (R). Arrowheads delimit the ectodermal expression, which is decreased in the crm- embryo, while the underlying mesodermal expression is preserved. In M-P, view is dorsal with anterior to the top. (S,T) Increased cell death in crm- embryos. (S) WT and (T) crmc4 mutant at 18 somites, with cell death visualized in situ by terminal transferase labeling of nuclear DNA. Arrowheads indicate cluster of apoptotic cells on posterior yolk, and arrow in (T) indicates apoptotic cells in the ventral mutant tail; however, increased cell death is not found in the CNS or its precursor cells (data not shown). View is from the side, with anterior to the left. Scale bars, 100 μm. EXPRESSION / LABELING:
PHENOTYPE:
|
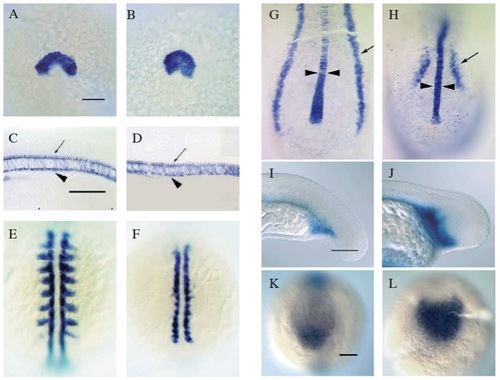
Differential response of mesodermal derivatives to loss of cerebum activity. (A,B) Expression of hgg-1 at the 4-6 somite stage in (A) WT and (B) crm mutant in presumptive hatching gland cells. (C,D) Expression of col2a1 in the trunk of WT (C) and mutant (D) [24 hours]. In addition to the notochord, col2a1 is expressed in the floor plate (arrows) overlying the notochord, and the hypochord (arrowheads), a row of endodermal cells beneath the notochord. (E,F) myoD expression [8 somite stage] in WT (E) and mutant (F). At least a subset of the myoD-expressing adaxial cells (Weinberg et al., 1996) are present in the mutant, consistent with the later development of muscle pioneers (S. Fisher, unpubl. obs.). (G,H) The width of the axial domain of lim1 expression (arrowheads) in the developing notochord is similar in WT (G) and mutant (H), while expression in the developing pronephric ducts (arrows) is greatly decreased in the mutant [8 somite stage]. (I,J) The expanded pool of blood precursor cells in the crm mutant (J) compared to WT (I) is revealed by expression of gata2 [20 somite stage]. (K,L) Ventral tail bud expression of eve1 [8 somite stage] is also expanded in the mutant (L) compared to WT (K). A,B and E-H are dorsal views, with anterior to the top. C,D,I and J are side views with anterior to the left. K and L are posterior views, with dorsal to the top. Scale bars = 100 mm; E-H and L are the same magnification as K. EXPRESSION / LABELING:
|
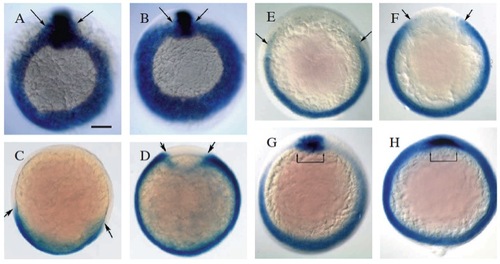
Domains of ventral markers are expanded in cerebum- gastrula. (A,B) Expression of ntl [80% epiboly] in WT (A) and crm mutant embryos (B). Mutants had fewer ntl-expressing cells adjacent to the dorsal axial mesoderm (arrows), and a broader domain of expression ventrally. (C,D) Expression of gata2 [80% epiboly] (arrows) spanned an approximately 120° region on the ventral side in WT (C) but spread to an approximately 315° region of the mutant margin (D). (E,F) Expression of eve1 in WT (E) and crm mutant embryos (F) at early shield stage [50% epiboly]. The expanded domain of eve1 expression is already apparent in the crm- embryo at early gastrulation (arrows). (G,H) Double labeling for expression of gsc and eve1 in WT (G) and mutant (H) embryos at late shield stage [55% epiboly]. Although the pattern of dorsal gsc expression is similar in WT and mutant embryos (brackets), the expansion of eve1 expression into the dorsolateral margin is even more apparent in the mutant at this stage. All embryos are oriented with dorsal to the top; A and B are vegetal pole views, and C-H are animal pole views. Scale bar, 100 μm. EXPRESSION / LABELING:
|