
- Title
-
Targeted Isolation of Antibiotic Brominated Alkaloids from the Marine Sponge Pseudoceratina durissima Using Virtual Screening and Molecular Networking
- Authors
- Lever, J., Kreuder, F., Henry, J., Hung, A., Allard, P.M., Brkljača, R., Rix, C., Taki, A.C., Gasser, R.B., Kaslin, J., Wlodkowic, D., Wolfender, J.L., Urban, S.
- Source
- Full text @ Mar. Drugs
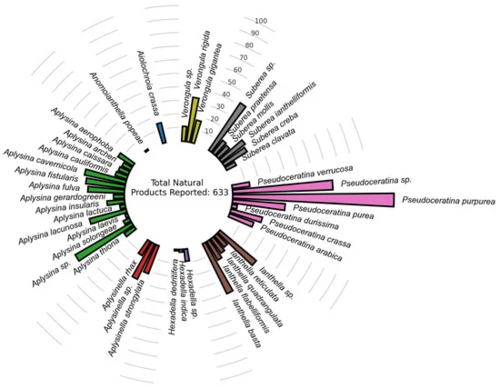
Figure 1. Primary dataset distribution of NPs previously reported for Verongiida sponges (Supplementary Materials). |
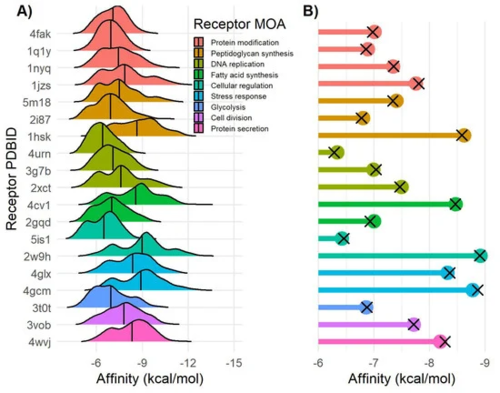
Figure 2. Docking affinity of Verongiida NPs data set. (A) Density distribution of affinity values for each MRSA target. (B) Lollipop plot representing mean value of Pseudoceratina NPs subset (colored dots) and Verongiida subset displaying activity against Staphylococcus pathogens in ChEMBL (black cross).
|
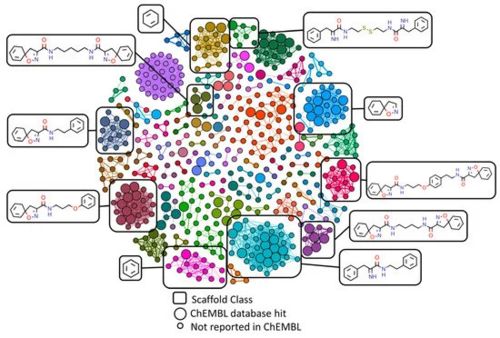
Figure 3. Similarity networking of Verongiida dataset against actives from ChEMBL database. Clustering applied to network illustrating the scaffolds representing the major clusters. Enlarged nodes representing the compounds that were reported as active against either Staphylococcus aureus or MRSA within ChEMBL database.
|
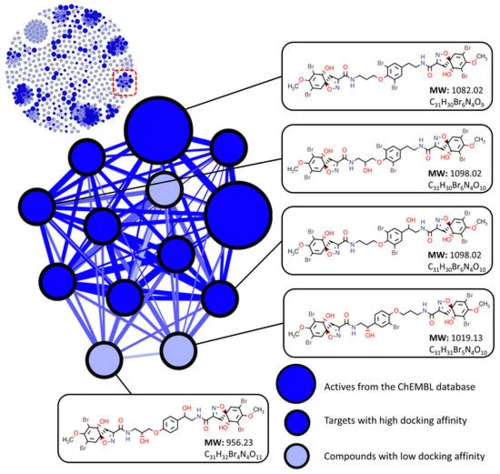
Figure 4. Target screening using similarity networking and molecular docking affinity scoring. Compounds are considered to have low docking affinity if they do not have an affinity score within the top 10 percent of values for at least one target receptor when compared to their cluster counterparts. |
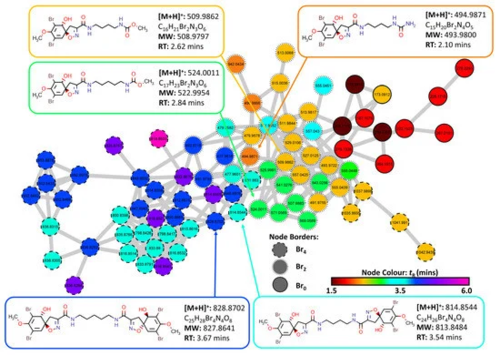
Figure 5. Cluster 6 containing spiroisoxazoline compounds and aerothionin derivatives extracted from the FBMN created from MS/MS data collected from analysis of the crude extracts of the four target organisms (2018_59, 2018_61, 2018_62 and 2018_63). The Node Border displays the number of bromine atoms present as indicated by MS1 data. Node color displays the retention time of each feature to identify potential adducts and different isotopes for individual compounds.
|
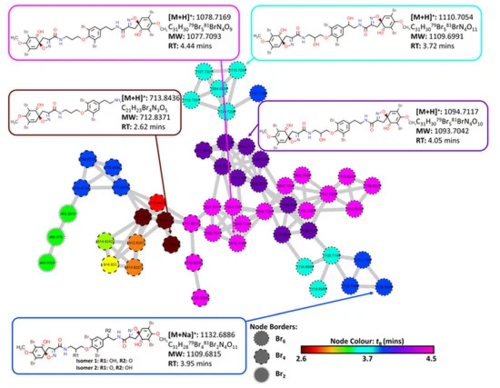
Figure 6. Cluster 13 containing bromotyramine linked spiroisoxazoline compounds and aerothionin derivatives extracted from the FBMN created from MS/MS data collected from analysis of the crude extracts of the four target organisms (2018_59, 2018_61, 2018_62 and 2018_63). Node border displays the number of bromine atoms present as indicated by MS1 data. Node color displays the retention time of each feature to identify potential adducts and different isotopes for individual compounds.
|
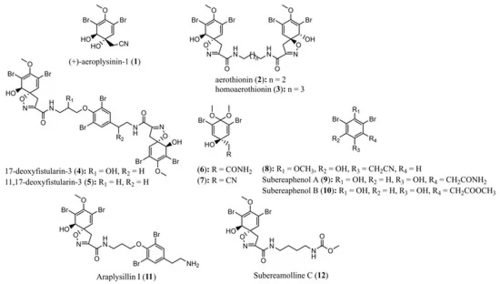
Figure 7. Structures of compounds 1−12 isolated from the marine sponge Pseudoceratina durissima.
|
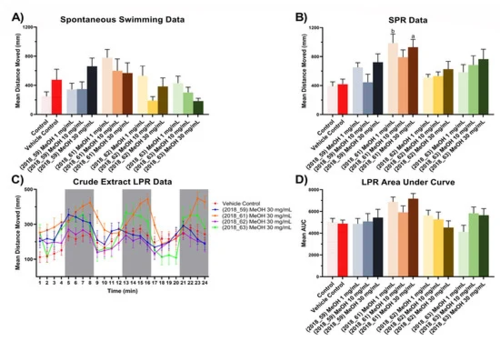
Figure 8. Zebrafish assay results for crude extracts (2018_59, 2018_61, 2018_62 and 2018_63). (A) Spontaneous, unstimulated swimming bioassay results for crude extracts (2018_59, 2018_61, 2018_62 and 2018_63) at concentrations of 1 mg/mL, 10 mg/mL and 30 mg/mL, (B) Stimulated Predator Response (SPR) bioassay results for crude extracts (2018_59, 2018_61, 2018_62 and 2018_63) at concentrations of 1 mg/mL, 10 mg/mL and 30 mg/mL, (C) Larval Photo-motor Response (LPR) bioassay results for crude extracts (2018_59, 2018_61, 2018_62 and 2018_63) at 30 mg/mL. All results for (A–C) are shown as mean ± SEM, n = 9. Results for (D) are shown as mean of the area under the curve ± SEM, n = 9. Significant difference between treatment and vehicle control indicated by letter a, b, c or d. (one-way ANOVA, Tukeys test, a: p < 0.05, b: p < 0.01, c: p < 0.001, d: p < 0.0001). Where no significant difference was observed between treatment and vehicle control no letter was included.
|
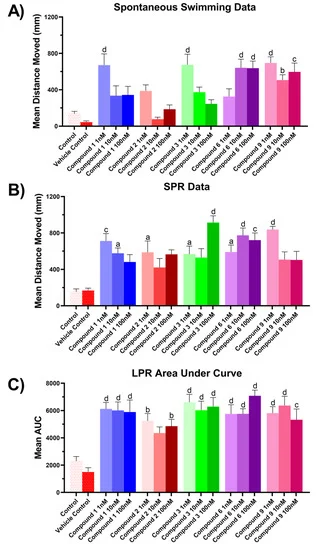
Figure 9. Zebrafish assay results for compounds 1–3, 6 and 9. (A) Spontaneous, unstimulated swimming bioassay, (B) SPR bioassay, (C) LPR bioassay. All results for (A) and (B) are shown as mean ± SEM, n = 9. Results for (C) are shown as mean of the area under the curve ± SEM, n = 9. Significant difference between treatment and vehicle control indicated by letter a, b, c or d. (one-way ANOVA, Tukeys test, a: p < 0.05, b: p < 0.01, c: p < 0.001, d: p < 0.0001). Where no significant difference was observed between treatment and vehicle control no letter was included.
|
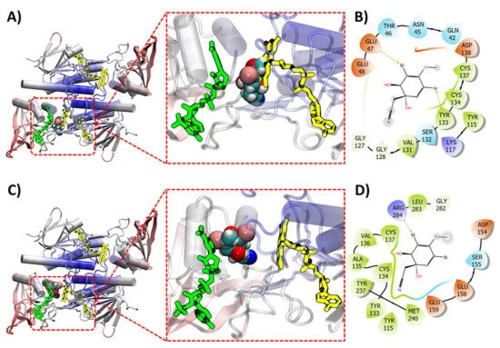
Figure 10. (A) (+)-aeroplysin-1 (1) (space filling model) shown docking with thioredoxin reductase (TrxB) (ribbon). Docking performed without presence of both FAD (yellow sticks) and NADPH (green sticks). (B) Intermolecular interaction between the ligand (+)-aeroplysinin-1 (1) and the target thioredoxin reductase (no FAD or NADPH during docking). (C) (+)-aeroplysin-1 (1) (space filling model) shown docking with thioredoxin reductase (TrxB) (ribbon). Docking performed with FAD (yellow sticks) present but not NADPH (green sticks). (D) Intermolecular interaction between the ligand (+)-aeroplysinin-1 (1) and the target thioredoxin reductase (FAD present during docking).
|