
- Title
-
mTOR-regulated mitochondrial metabolism limits mycobacterium-induced cytotoxicity
- Authors
- Pagán, A.J., Lee, L.J., Edwards-Hicks, J., Moens, C.B., Tobin, D.M., Busch-Nentwich, E.M., Pearce, E.L., Ramakrishnan, L.
- Source
- Full text @ Cell
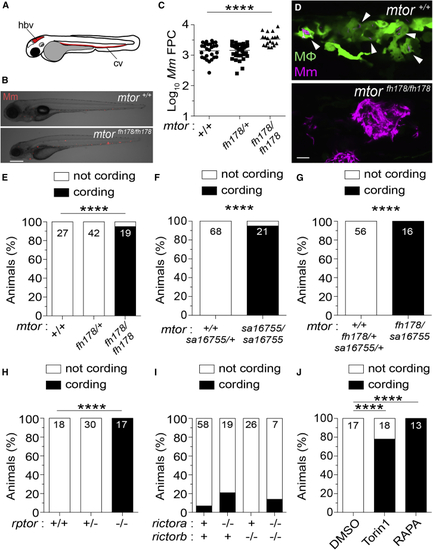
mTORC1-deficient zebrafish are hypersusceptible to Mm infection (A) Hindbrain ventricle (hbv) and caudal vein (cv) injection routes used in this study. Larvae were infected with ∼150 Mm expressing tdTomato (B), (C), and (E–J) or tdKatushka2 (D) fluorescent proteins via the caudal vein 2 days post-fertilization (dpf). (B) Overlaid micrographs of widefield mycobacterial fluorescence (Mm, red) and bright field in (C) Quantification of bacterial fluorescence (fluorescent pixel counts [FPCs]) in animals from (D) Confocal micrograph optical sections of (E–J) Mycobacterial cording in animals from (E) (E–J) Numbers within columns indicate animals per group. Scale bars: 300 μm in (B) and 25 μm in (D). Statistical analyses, (C) one-way ANOVA with Tukey’s post-test and (E–J) Fisher’s exact test. Data are representative of two or more independent experiments. |
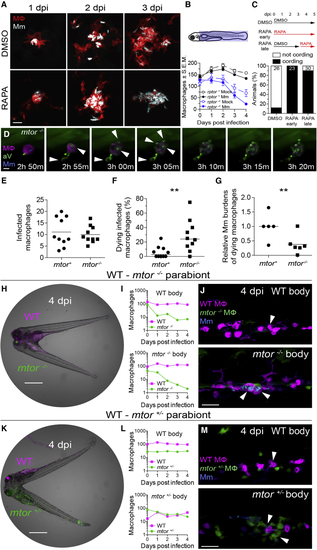
mTOR deficiency impairs macrophage development and survival and sensitizes infected macrophages to mycobacterium-induced cytotoxicity Larvae were infected with Mm expressing BFP2 (A), (E), and (I–N), mWasabi (C and D), or tdKatushka2 (F–H) fluorescent proteins via the hindbrain ventricle (A) or the caudal vein (B–N) 2 dpf. (A) Serial confocal micrographs of granulomas in (B) (Top) Macrophage counting region (shaded light blue). (Bottom) Numbers of macrophages in Mm- and mock-infected Raptor mutants and siblings expressing (C) (Top) Duration of rapamycin and DMSO treatments. (Bottom) Mycobacterial cording 5 dpi. (D) Time-lapse confocal micrographs of a dying infected macrophage in an (E–G) 6-h time-lapse confocal microscopy of (E) Absolute numbers of infected macrophages per field. (F) Percentage of dying infected macrophages per field. (G) Relative mycobacterial burdens in dying macrophages of (H) Widefield micrograph of parabiotic zebrafish comprised of conjoined WT (I) Absolute numbers of macrophages in the WT body (top) and (J) Maximum intensity projections of infections in the WT body (top) and (K) Widefield micrograph of WT (L) Absolute numbers of macrophages in the WT body (top) and (M) Maximum intensity projections of infections in the WT body (top) and Scale bars: 25 μm in (A), 10 μm in (D), 400 μm in (H) and (K), and 50 μm in (J) and (M). Horizontal lines indicate mean (E) and (G) or median (F) values. Statistical analyses, (E–G) two-tailed, unpaired Student’s t test. Time lapse data were pooled from five (E and F) or three (G) independent experiments. See also |
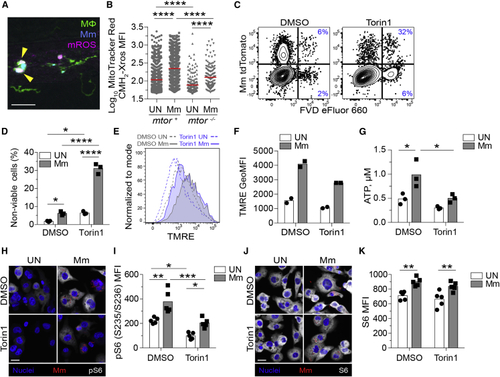
mTOR deficiency impairs basal and mycobacterium-stimulated mitochondrial metabolism in macrophages (A and B) (A) Confocal micrograph illustrating mROS detection in an infected animal. Macrophages (green), Mm (blue), mROS (magenta), mROS-producing infected cells (arrowheads). Scale bar, 20 μm. (B) MitoTracker Red CMH2-Xros mean fluorescence intensity (MFI) in infected and uninfected macrophages of (C–K) THP-1 macrophages were treated with torin1 or DMSO and infected with (C, D, G, and H–K) tdTomato- or (E and F) mWasabi-expressing Mm at a multiplicity of infection (MOI) of 1 (C–F) or 3 (G and H–K). (C) Flow cytometry plots of cell viability 2 dpi. Percentages of non-viable cells (FVD eFluor 660+) in the infected and uninfected subpopulations are shown. (D) Quantification of non-viable cells. Symbols represent values from individual wells. Bars indicate mean values. (E) Flow cytometry histograms of TMRE fluorescence 1 dpi. (F) TMRE geometric mean fluorescence intensities (GeoMFIs) 1 dpi. Symbols represent values from individual wells. Bars indicate mean values. (G) ATP concentration per well containing 106 THP-1 macrophages 1 dpi. (H–K) 1 dpi THP-1 macrophage cultures infected with tdTomato-expressing Mm (MOI = 2) were treated with torin1 or DMSO for 4 h in serum-free media.Confocal micrographs depicting Hoechst-stained nuclei (blue), Mm (red), and (H) phospho-S6S235/S236 or (J) total S6 staining (white). Scale bars, 20 μm. (I and K) Mean fluorescent intensity (MFI) of (I) phospho-S6S235/S236 and (K) total S6 staining in uninfected and infected cells. Bars indicate group means. Symbols depict average MFI per field. Statistical analyses, (B) one-way or (D), (G), (I), and (K) two-way ANOVA with Tukey’s post-test. (A), (B), and (H–K) Data are representative of two experiments. See also |
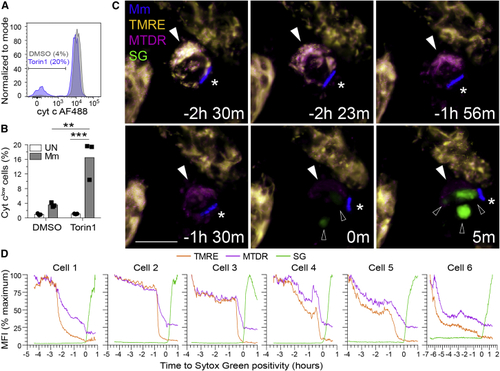
mTOR deficiency promotes mycobacterium-induced, mitochondrially mediated cell death (A and B) THP-1 macrophages were infected with (A and B) tdTomato- or (C and D) BFP-expressing Mm at MOI = 3. (A) Flow cytometry histograms of cytochrome (B) Quantification of cyt clow cells 7 hpi. (C and D) Torin1-treated THP-1 macrophages were labeled with TMRE and MitoTracker Deep Red prior to imaging in the presence of Sytox Green 32 hpi. See (C) Confocal micrographs of a dying infected macrophage (filled arrowhead) surrounded by surviving uninfected macrophages. Mm (asterisk), Sytox Green (open arrowheads). Scale bars, 10 μm. (D) MFI of TMRE, MitoTracker Deep Red, and Sytox Green staining of dying infected macrophages over time. Key time-lapse frames for cell 1 are shown in (C). Statistical analyses, (B) two-way ANOVA with Tukey’s post-test. |
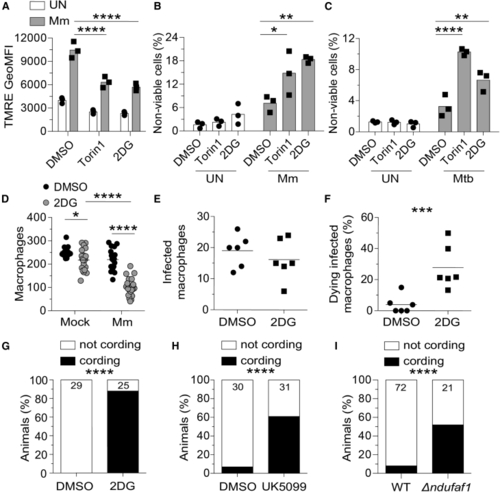
Glycolysis inhibition impairs mitochondrial metabolism and sensitizes infected macrophages to mycobacterium-induced cytotoxicity (A–C) THP-1 macrophages treated with torin1 (400 nM), 2-deoxy-D-glucose (2DG, 5 mM), or DMSO were infected with Mm expressing (A) BFP2, (B) tdTomato, or (C) Mtb expressing tdTomato (MOI = 1). (A) TMRE GeoMFI 1 dpi. (B and C) Percentage of non-viable cells (FVD eFluor 660+) 1 dpi. (D–I) Zebrafish were infected with ∼150 fluorescent Mm via the caudal vein. (D) 5 dpi macrophage numbers in the body of mock- or Mm (E and F) 6-h time-lapse confocal microscopy of (G) Cording in wild-type (WT) animals treated with 2DG or DMSO 5 dpi. (H) Cording in WT animals treated with UK5099 (10 μM) or 0.5% DMSO 5 dpi. (I) Cording in Symbols represent values from individual (A–C) and (K) wells or (D–F) animals. (A–C) Bars and (D–F) horizontal lines indicate mean values. (G–I) Numbers within columns indicate animals per group. Statistical analyses, one-way ANOVA with (A–C) Sidak, (D) Tukey post-tests, (E and F) unpaired Student’s t test, or (G–I) Fisher’s exact test. (E and F). Time-lapse data were pooled from two independent experiments. Data are representative of (A), (G), and (H), two independent experiments. See also |
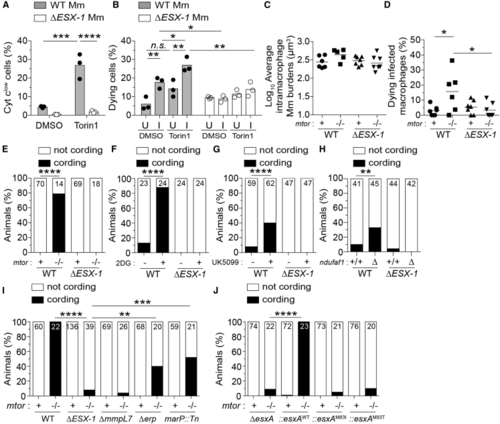
Deficiencies in mTOR, glycolysis, and OXPHOS sensitize macrophages to mycobacterial ESAT-6-dependent cytotoxicity (A) Cytochrome (B) Percentage of dying cells (Sytox Green+) during 4-h time-lapse at 1 dpi with tdTomato-expressing WT or Δ (C–J) Zebrafish were infected with dose-matched inocula of tdTomato-expressing Mm of the indicated strains via the caudal vein. (C) Intramacrophage Mm burdens at the beginning of 6-h time-lapse confocal microscopy of (D) Percentage of dying infected macrophages in same experiment shown in (C). See (E) Cording in (F and G) Cording in WT zebrafish treated with 2DG, UK5099, or DMSO 5 dpi. (H) Cording in (I) Cording in (J) Cording in Symbols represent values from individual (A) wells, (B) imaging fields, or (C) animals. (A and B) Bars and (C and D) horizontal lines indicate mean values. (E–J) Numbers within columns indicate animals per group. Statistical analyses, (A–D) one-way ANOVA with Sidak’s post-test or (E–J) Fisher’s exact test. (B, E, and H) Data are representative of two experiments. Zebrafish time-lapse data were pooled from four experiments. See also |
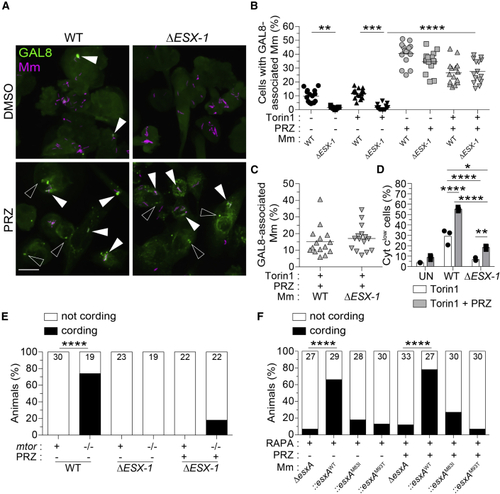
ESAT-6 mediates mitochondrial damage in mTOR-deficient macrophages downstream of its involvement in phagosomal permeabilization (A–E) Torin1- and DMSO-treated THP-1 macrophages were infected with tdTomato-expressing WT or Δ (A) Confocal micrographs of galectin-8 (GAL8) immunofluorescence (green) and Mm fluorescence (magenta) in THP-1 macrophages 7 hpi. GAL8 foci associated with Mm (filled arrowheads) or not associated with Mm (open arrowheads) are shown. Scale bar, 20 μm. (B) Percentage of macrophages with GAL8-associated Mm foci. (C) Percentage of Mm volume associated with GAL8 foci 7 hpi. (D) Percentage of cells that have released cytochrome (E) (F) Wild-type fish treated with 400 nM rapamycin were infected with ∼180 tdTomato-expressing Symbols represent values from individual (B and C) imaging fields or (D) individual wells. (B and C) Horizontal lines and (D) bars indicate mean values. (E and F) Numbers within columns indicate animals per group. Statistical analyses, (B and D) one-way ANOVA with Sidak’s post-test or (E and F) Fisher’s exact test. See also |
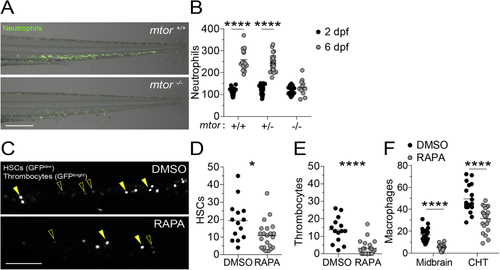
mTOR deficiency impairs hematopoiesis in zebrafish, related to (A) Overlaid widefield fluorescence and bright-field micrographs of an (B) Numbers of neutrophils in the caudal hematopoietic tissue (CHT) of animals from (C–F) Zebrafish embryos were manually dechorionated and treated with 400 nM rapamycin or 0.5% DMSO on 1 dpf to block primitive and intermediate waves of hematopoiesis ( (C) Confocal micrographs of the CHT of (D) Numbers of HSCs in the CHT of 2 dpf animals. (E) Numbers of thrombocytes in the CHT of 2 dpf animals. (F) Numbers of macrophages in the midbrain and CHT of Scale bars: 300 μm in (A) and 100 μm in (C). (B and D–F) Symbols represent individual animals. Horizontal lines indicate means. Statistical analyses, (B) two-way ANOVA with Tukey’s post-test and (D–F) unpaired Student’s t test. |
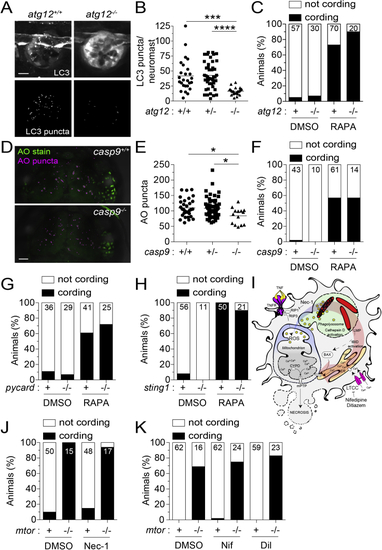
Inhibition of autophagic cell death, mitochondrial apoptosis, or TNF-associated necrosis does not prevent mycobacterium-induced macrophage death in mTOR-deficient animals, related to (A) Confocal micrographs of LC3 aggregation in neuromasts, clusters of mechanosensory cells of the fish lateral line, from (B) Number of LC3 puncta per neuromast. (C) Cording in rapamycin- or DMSO-treated (D) Confocal micrographs of acridine orange (AO) staining (green) and surface-rendered puncta (magenta) in the midbrain of (E) Number of AO puncta in the midbrain. (F) Cording in rapamycin- or DMSO-treated (G) Cording in rapamycin- and DMSO-treated (H) Cording in rapamycin- and DMSO-treated (I) Necrosis pathway induced by mycobacterial infection plus excess TNF and pharmacological interventions tested. (J and K) Mycobacterial cording in Symbols represent individual (B) neuromasts or (E) animals. (B and E) Horizontal lines indicate mean values. (C, F–H, J, and K) Numbers within columns indicate animals per group. (B and E) One-way ANOVA with Tukey’s post-test. |
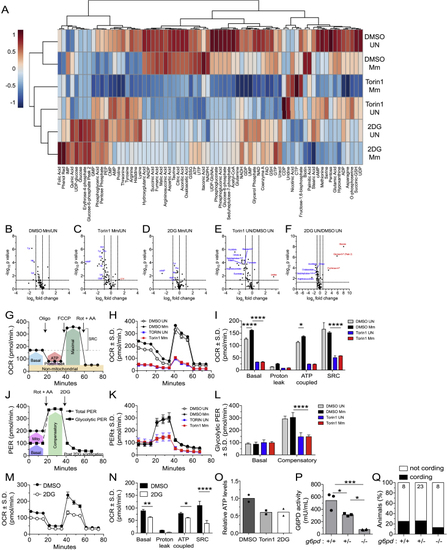
mTOR inhibition impairs glycolysis and mitochondrial metabolism, related to (A) Metabolite profiles of uninfected and Mm-infected THP-1 macrophages 1 dpi (MOI = 1). Cell were treated with torin1 (400 nM), 2DG (5 mM), or 0.5% DMSO for 1.5 days prior to harvest. Heat map scale indicates relative log2 expression levels. See also (B–F) Volcano plots of differences in metabolite abundances induced by the indicated treatments. Dashed lines indicate fold-change and p value cutoffs. (G) Diagram of mitochondrial oxygen consumption rate (OCR) assay. (H) OCR kinetics of torin1 or DMSO-treated THP-1 macrophages 1 dpi (Mm, MOI = 4). (I) Modular analysis of mitochondrial OCR. (J) Diagram of glycolytic proton efflux rate (PER) assay. (K) PER kinetics of torin1 or DMSO-treated THP-1 macrophages 1 dpi (Mm, MOI = 4). (L) Basal and compensatory glycolytic PER. (M) OCR kinetics of uninfected THP-1 macrophages treated with 2DG or DMSO for 1.5 days. (N) Modular analysis of mitochondrial OCR. (O) Relative ATP levels in THP-1 macrophage cultures 1.5 days after treatment. (P) Glucose-6-phosphate dehydrogenase (G6PD) activity in 5 dpf animals from (Q) Cording in animals from Symbols represent (B–F) individual metabolites, (H, K, and M) mean values, (O) individual wells, or (P) individual animals. (I, L, and N–P) Bars indicate mean values. (H, I, and K–N) Error bars depict standard deviation. (G and J) Arrows indicate the time of compound injection. Abbreviations: rotenone plus antimycin A (Rot + AA), 2DG, oligomycin (Oligo), carbonyl cyanide 4-(trifluoromethoxy)phenylhydrazone (FCCP), compensatory glycolysis (Comp), spare respiratory capacity (SRC). Statistical significance, (B–F) unpaired Students’ t test, one-way ANOVA with (I, L, and N) Sidak or (P) Tukey’s post-tests. |
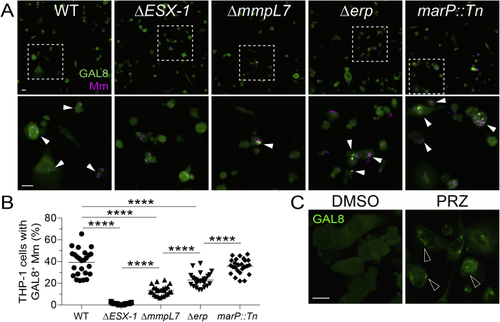
Damage of phagosomal/lysosomal compartments by ESX-1-competent mycobacteria and the drug prazosin, related to (A) Confocal micrographs of galectin-8 (GAL8) immunofluorescence (green) and Mm fluorescence (magenta) in THP-1 macrophages infected with the indicated Mm strains (MOI = 1) 1 dpi. The (B) Percentage of macrophages with foci of GAL8-associated Mm. Symbols represent values from individual imaging fields. Horizontal bars indicate mean values. One-way ANOVA with Tukey’s post-test. (C) Confocal micrographs of GAL8 immunofluorescence 7 h after treatment with prazosin (PRZ, 20 μM) or 0.5% DMSO. Arrowheads indicate GAL8 puncta. Scale bars, 20 μm. |
Reprinted from Cell, 185(20), Pagán, A.J., Lee, L.J., Edwards-Hicks, J., Moens, C.B., Tobin, D.M., Busch-Nentwich, E.M., Pearce, E.L., Ramakrishnan, L., mTOR-regulated mitochondrial metabolism limits mycobacterium-induced cytotoxicity, 3720-3738.e13, Copyright (2022) with permission from Elsevier. Full text @ Cell