FIGURE SUMMARY
Title

Reduced sister chromatid cohesion acts as a tumor penetrance modifier

Authors
Wang, J., Thomas, H.R., Chen, Y., Percival, S.M., Waldrep, S.C., Ramaker, R.C., Thompson, R.G., Cooper, S.J., Chong, Z., Parant, J.M.
Source
Full text @ PLoS Genet.

Esco2 deficiencies are common in multiple tumor types and associated with poor patient survival.

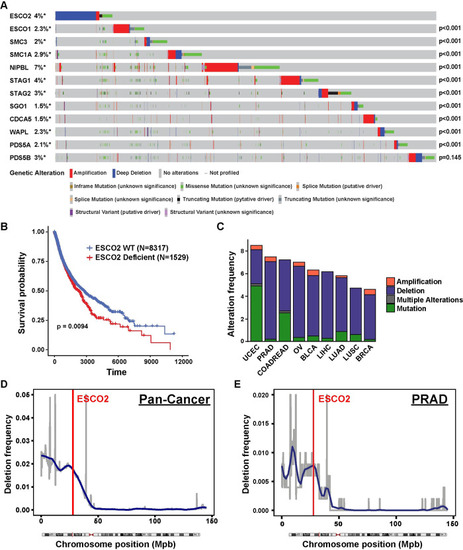
(A) Oncoprint plot of genetic alterations in ESCO2 and other SCC-associated genes in TCGA dataset. N = 10950. Number of samples with each mutation: N(ESCO2) = 404, N(ESCO1) = 252, N(SMC3) = 216, N(SMC1A) = 322, N(NIPBL) = 743, N(STAG1) = 429, N(STAG2) = 374, N(SGO1) = 165, N(CDCA5) = 159, N(WAPL) = 248, N(PDS5A) = 227 and N(PDS5B) = 375. P-values shown in the figure indicate significance of co-occurrence with ESCO2 from one-sided Fisher Exact test. (B) Kaplan-Meier survival analysis of patients with ESCO2 deficient (N = 1529) versus ESCO2 WT (N = 8317) tumors within TCGA dataset samples. P-value was determined by log-rank test. (C) Stacked bar plot indicating the percentage of patients with an ESCO2 deletion (blue), amplification (red) or mutation (green) and multiple alterations (grey) in uterine corpus endometrioid (UCEC), prostate (PRAD), colorectal (COADREAD), ovarian (OV), bladder (BLCA), liver (LIHC), lung adenocarcinoma (LUAD), lung squamous (LUSC), and breast cancer (BRCA) in the TCGA dataset. Cancer type is ordered based on the genetic alteration frequency. Number of samples with mutation/ total samples in each cancer type: 45/529 UCEC, 37/494 PRAD, 43/594 COADREAD, 41/584 OV, 26/411 BLCA, 23/372 LIHC, 33/566 LUAD, 23/487 LUSC, 50/1084 BRCA. The frequency of deletion in 100 kbp windows throughout Chromosome 8 in 1,111 pan-cancer type (Figure D, N = 11203) and prostate adenocarcinoma (PRAD, Figure E, N = 502) cancer patients. A region is considered as deleted if Log2 (Copy Number/2) < -1. Blue line shows smoothed deletion frequency. Red vertical line indicates the locus of ESCO2 gene.

Esco2 deficiencies accelerate tumor onset in a LOH-sensitive background.

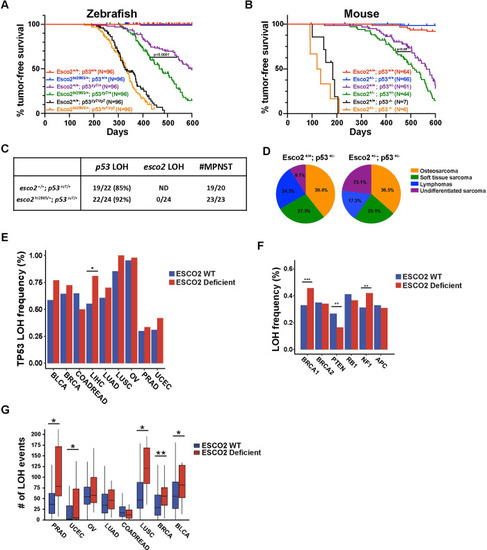
(A) Zebrafish Kaplan-Meier curves for tumor-free survival for wild-type, esco22865/+, p53J19/+, esco22865/+; p53J19/+, p53J19/J19, and esco22865/+; p53J19/J19 cohorts. Compared cohorts were established by natural single pair breeding of esco2m/+ x AB (wild-type strain), esco2m/+; p53m/m x AB, or esco2m/+; p53m/m x p53m/m parents (all cohorts were n = 96). The p-value = <0.0001 when comparing p53J19/+ with esco22865/+; p53J19/+ cohorts based on Log-rank (Mantel-Cox) test. (B) Mouse Kaplan-Meier curves for tumor-free survival for wild-type, Esco2 +/-, p53 +/-, Esco2 +/-; p53 +/- and p53 -/- cohorts (cohorts with p53+/+ and p53+/- background were n>60 and cohorts with p53-/- background were n>6). The p-value = <0.05 when comparing p53+/- with esco2+/-; p53+/- curves based on Log-rank (Mantel-Cox) test. (C) Frequency of p53 wild-type loss of heterozygosity (LOH) and esco2 wild-type LOH in zebrafish tumors; as well as the frequency of tumors being Malignant Peripheral Nerve sheath tumors (MPNST). (D) Pie charts showing tumor spectrum in Esco2+/+; p53+/- (left panel) and Esco2+/-; p53+/- (right panel) mice. No statistically significant in tumor spectrum with Chi-square test. (E) Percentage of patients with LOH on TP53 in TCGA cancer samples with or w/o ESCO2 mutation/deletion. The number of WT and deficient samples in each tumor were indicated. BLCA: 393 WT + 13 Deficient; BRCA: 935 WT + 29 Deficient; COADREAD: 482 WT + 38 Deficient; LIHC: 333 WT + 21 Deficient; LUND: 495 WT + 10 Deficient; LUSC: 478 WT + 8 Deficient; OV: 383 WT + 46 Deficient; PRAD: 481 WT + 6 Deficient; UCEC: 479 WT + 43 Deficient. * indicates p<0.05 from Fisher’s exact test. (F) Percentage of patients with LOH covering in tumor suppressor gene PTEN, BRCA1, BRCA2, RB1, NF1 and APC in the TCGA dataset. N = 4,126 for ESCO2-WT cohort and N = 193 for ESCO2-deficiency cohort. ** and *** indicate p<0.01 and p<0.001 with Fisher’s Exact test. (G) The number of LOH events per tumor sample in TCGA cancer samples with or w/o ESCO2 mutation/deletion. The number of WT and deficient samples in each tumor were indicated: PRAD: 481 WT + 6 Deficient; UCEC: 479 WT + 43 Deficient; OV: 383 WT + 46 Deficient; LUAD: 495 WT + 10 Deficient; COADREAD: 482 WT + 38 Deficient; LUSC: 478 WT + 8 Deficient; BRCA: 935 WT + 29 Deficient; BLCA: 393 WT + 13 Deficient. * and ** indicate p<0.05 and p<0.01 from Mann-Whitney test.

Reduced SCC in esco2 and sgol1 haploinsufficient animals correlates with accelerated tumor onset.

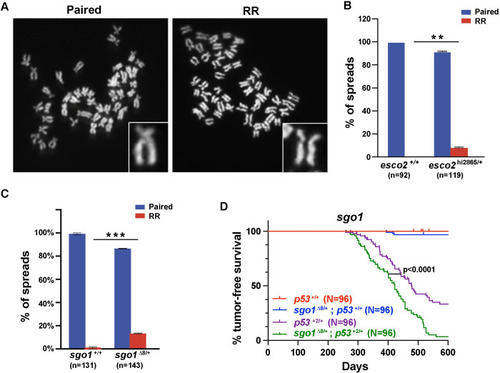
(A) Representative images of “paired” and “railroad” (RR) metaphase spreads. Inset shows zoomed-in view of each phenotype. (B) The percentage of metaphase spreads in esco2+/+ and esco22865/+ showing paired or RR phenotypes. Two pools of embryos were used for esco2+/+ and esco22865/+ spreads from two independent experiments. A total of 92 esco2+/+ and 119 esco22865/+ spreads were tallied. (C) The percentage of spreads in sgo1+/+ and sgo1+/- showing paired or RR phenotypes. Three pools of embryos were used for sgo1+/+ and sgo1m/+ spreads. A total of 131 sgo1+/+ and 142 sgo1+/- spreads were tallied. ** p-value < 0.01 and *** p-value < 0.001 by paired t-test. (D) Kaplan-Meier curves for tumor-free survival for p53+/+, sgo1+/-; p53+/+, p53+/- and sgo1+/-; p53+/- cohorts. Cohorts were established by natural single-pair breeding of sgo1+/- X p53+2/+ parents (all cohorts were n = 96). P-value = <0.0001 when comparing p53+/- with sgo1+/-; p53+/- curves based on Log-rank (Mantel-Cox) test.

Elevated mitotic segregation errors in esco2 haploinsufficient embryos.

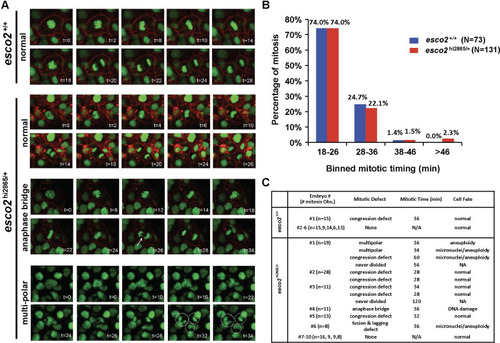
(A) in-vivo confocal imaging of H2A.F/Z-EGFP and CaaX-mCherry mRNA injected embryos at 24 hours post-fertilization (hpf) for two hours. Representative images of normal and defective mitoses in esco2+/+ and esco2m/+. Arrow in anaphase bridge time-lapse points towards the anaphase bridge formed. Dotted circular in tri-polar time-lapse represents the three future nuclei that will occur. CaaX-mCherry was removed in tri-polar time-lapse for better visualization. t = time in minutes. (B) Division time calculated for each division in six esco2+/+ and ten esco2m/+embryos using two-hour imaging time-lapse data from each embryo. The percentage of cells was calculated for each bin category. N = 73 for esco2+/+ and N = 132 for esco2m/+. (C) Table representing mitotic defects and the associated mitotic timing and cell fate observed in six esco2+/+ and ten esco2m/+embryos.

Elevated micronuclei during embryogenesis does not contribute to enhanced tumor onset.

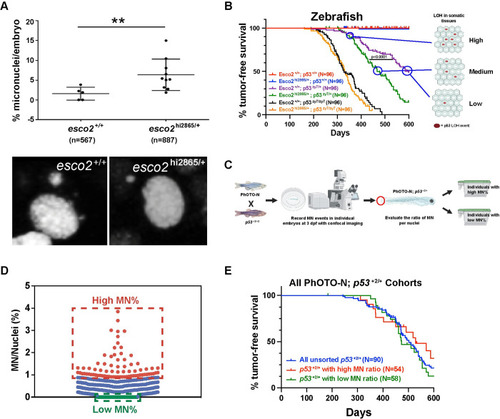
(A) Micronuclei (MN) during interphase were counted in six esco2+/+ and ten esco22865/+ H2A.F/Z-EGFP mRNA injected embryos at 24hpf using two-hour live imaging time-lapse data from each embryo. Each dot represents an embryo measured. Percentage MN/embryo was calculated based on the total number of micronuclei per total nuclei present in the time lapse at t = 0. Total nuclei are indicated in parenthesis. Mean ± SD, ** p-value < 0.01 based on unpaired t-test. Representative black and white images of micronuclei in each genotype are shown below. (B) Proposed model where the proportion of cells with MN would correlate with p53 LOH and timing of tumor formation. (C) Experimental workflow to establish high and low MN cohorts, using confocal living-imaging of 3-dpf p53+2/+; TGPhOTO-N/+ embryos. Figure B and C were created with BioRender.com. (D) Dot-blot of Micronuclei frequency in individual 3-dpf p53+2/+; TGPhOTO-N/+ embryos. Individuals deemed part of the high MN cohort were highlighted with red (MN%>0.9%) and individuals in the low MN cohort were highlighted with green (MN% = 0). (E) Zebrafish Kaplan-Meier curves for tumor-free survival for p53+2/+; TGPhOTO-N/+ unsorted (n = 90), p53+2/+; TGPhOTO-N/+ with high NM ratio(n = 54) and p53+2/+; TGPhOTO-N/+ with high NM ratio (n = 58). P-value is not significance when comparing each other based on Log-rank (Mantel-Cox) test.

Reduced SCC allows for elevated mitotic recombination derived LOH.

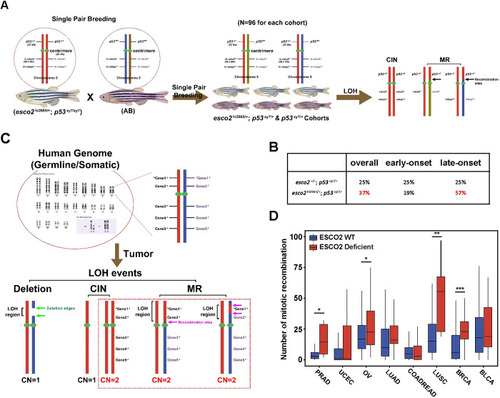
(A) Schematic of determining LOH mechanisms/types in p53 heterozygous tumors. The haplotype of nearby p53 marker in tumor and normal paired samples, cooccurring with p53 wild-type or mutant gene are labeled (left). (B) A table showing the percentage of mitotic recombination (MR) in esco2+/+; p53zy7/+ and esco2hi2865/+; p53zy7/+ tumors. (C) Schematic of determining the mitotic recombination with TCGA database. Figure A and C were created with BioRender.com. (D) The number of mitotic recombination in TCGA cancer samples with or w/o ESCO2 mutation/deletion. Genome-wide data was downloaded from NCI Genomic Data Commons. The number of WT and deficient samples in each tumor were indicated: PRAD: 481 WT + 6 Deficient; UCEC: 479 WT + 43 Deficient; OV: 383 WT + 46 Deficient; LUAD: 495 WT + 10 Deficient; COADREAD: 482 WT + 38 Deficient; LUSC: 478 WT + 8 Deficient; BRCA: 935 WT + 29 Deficient and BLCA: 393 WT + 13 Deficient. *, ** and *** indicate p<0.05, p<0.01 and p<0.001 from Mann-Whitney test.

Acknowledgments
This image is the copyrighted work of the attributed author or publisher, and ZFIN has permission only to display this image to its users. Additional permissions should be obtained from the applicable author or publisher of the image. Full text @ PLoS Genet.