
- Title
-
mafba and mafbb differentially regulate lymphatic endothelial cell migration in topographically distinct manners
- Authors
- Arnold, H., Panara, V., Hußmann, M., Filipek-Gorniok, B., Skoczylas, R., Ranefall, P., Gloger, M., Allalou, A., Hogan, B.M., Schulte-Merker, S., Koltowska, K.
- Source
- Full text @ Cell Rep.
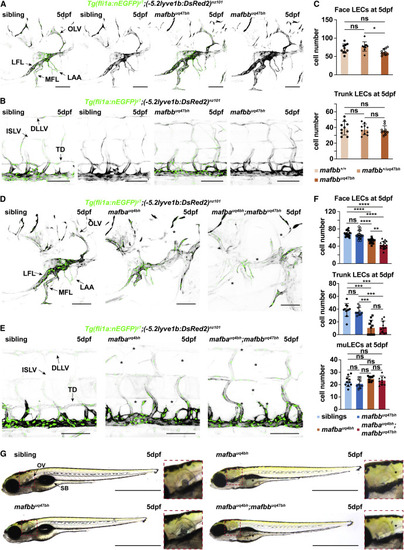
Figure 1. mafba and mafbb are required for facial lymphatic development (A and B) Confocal images of (A) face and (B) trunk lymphatics labeled with Tg(fli1a:nEGFP) (endothelial nuclei, green) and Tg(-5.2lyve1b:DsRed2) (VECs and LECs, grey) in sibling and mafbb mutants at 5 dpf. LFL, lateral facial lymphatic; MFL, medial facial lymphatic; LAA, branchial lymphatic arches; OLV, otolithic lymphatic vessel; DLLV, dorsal longitudinal lymphatic vessel; ISLV, intersegmental lymphatic vessel; TD, thoracic duct. Scale bars, 100 μm. (C) Quantification of LECs in the face and trunk based on (A) in wild-type (mafbb+/+), mafbb heterozygous (mafbb+/uq47bh), and mafbb homozygous mutants (mafbbuq47bh) at 5 dpf. Embryos per genotypes; n = 10. One-way ANOVA: ∗p = 0.0174 for mafbb+/uq47bh versus mafbbuq47bh in face LECs, ns p ≥ 0.177 for other comparisons. (D and E) Confocal images of (D) facial and (E) trunk lymphatics at 5 dpf for siblings and mafba and mafba;mafbb mutants. Transgenic markers described in (A). ∗: absent lymphatics. Scale bars, 100 μm. (F) LEC quantification at 5 dpf; embryos per genotype; n = 17 (face), n = 11 (trunk), n = 10 (muLECs). One-way ANOVA: p values for facial LECs: ns p = 0.7733 for siblings versus mafbb mutants; ∗∗∗∗p < 0.0001 for siblings versus mafba or mafba;mafbb mutants and for mafbb versus mafba or mafba;mafbb mutants; ∗∗p < 0.0047 for mafba versus mafba;mafbb mutants. p values for trunk LECs: ∗∗∗p ≤ 0.0004 for siblings versus mafba or mafba;mafbb and mafba versus mafbb mutants; ∗∗p ≤ 0.0029 for mafbb versus mafba;mafbb mutants. Other comparisons: ns p ≥ 0.9999. Kruskal-Wallis test for muLECs: ns p = 0.070. (G) Gross morphology of embryos at 5 dpf. ∗: absent structures; OV, otolithic vesicle; SB, swim bladder. Scale bars, 1 mm. ns, non-significant; stars are significant; error bars are mean ±SD. See also Figure S1. EXPRESSION / LABELING:
PHENOTYPE:
|
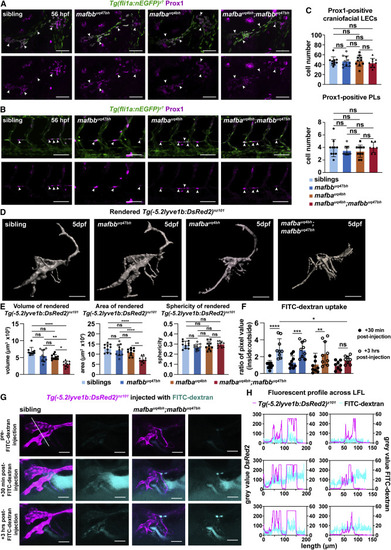
Figure 2. mafba and mafbb regulate lymphatic-vessel morphology and function but not specification (A and B) Prox1-positive LECs (magenta) (arrows) co-labeled with Tg(fli1a:nEGFP) (green) at 56 hpf in (A) face and (B) trunk in siblings and mafbb, mafba, and double mutants. Scale bars, 50 μm. (C) LEC progenitors quantification of Prox1 and Tg(Fli1a:nEGFP) double-positive cells. Embryos per genotype; n = 10; Kruskal-Wallis test: ns p ≥ 0.5331. (D) Surface rendering of Tg(-5.2lyve1b:DsRed2) for siblings and mafbb, mafba, and double mutants from confocal z stack images at 5 dpf. Scale bars, 100 μm. (E) Quantification of rendered surfaces. Embryos per genotype; n = 10. (left) Volume Kruskal-Wallis: ∗∗∗∗p < 0.0001 for siblings versus double mutants; ∗∗p = 0.0079 for mafbb versus double mutants; ∗p = 0.045 for mafba versus double mutants; ns for all other comparisons p ≥ 0.244. (Center) Area. One-way ANOVA: ∗∗∗∗p < 0.0001 for siblings or mafbb versus double mutants; ∗∗p < 0.0025 for mafba versus double mutants; ns for all other comparisons p ≥ 0.186. (Right) Sphericity. One-way ANOVA: ns p ≥ 0.234. (F) Uptake of FITC-dextran presented as a ratio of the average pixel value of z slices inside and outside the lymphatics. siblings n = 9, mafbb n = 9, mafba n = 9, and double mutants n = 8. Two-way ANOVA: from +30 min to +3 h post-FITC-dextran injection uptake is ∗∗∗∗p < 0.0001 for siblings ∗∗∗p = 0.0003 for mafbb, ∗∗p = 0.0014 for mafba, and ns p = 0.2415 for double mutants. +3 h post-FITC-dextran injection FITC-dextran uptake: ∗p = 0.0265 for siblings versus double mutants. Other interactions: ns p ≥ 0.0626. (G) Confocal projection of LFL with FITC-dextran (cyan) and Tg(-5.2lyve1b:DsRed2) (magenta) in siblings and double mutants at 5 dpf. Images of pre-injection, +30 min and +3 h post-injection. Scale bars, 100 μm. White line: trajectory for graphs in (H). (H) Fluorescence profile of Tg(-5.2lyve1b:DsRed2) (magenta) and FITC-dextran (cyan) intersecting the lymphatics from (G). ns, non-significant; stars are significant; error bars are mean ±SD. See also Figure S2 and Videos S1, S2, S3, and S4. |
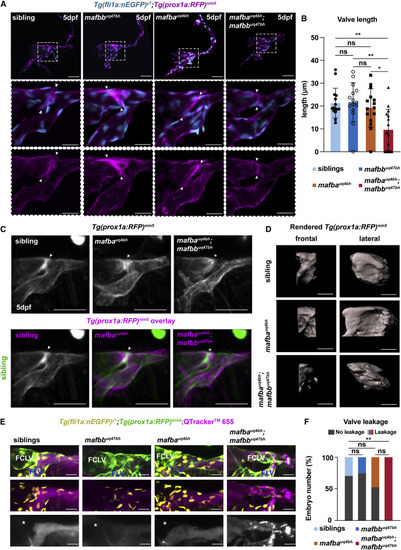
Figure 3. mafba and mafbb are required for valve formation and function in the facial lymphatics (A) Confocal projection of facial lymphatics and valve (arrowheads) labeled with Tg(fli1a:nEGFP) (cyan) and Tg(prox1a:RFP) (magenta) at 5 dpf, masked with surface rendering of both channels. Scale bars: 50 and 20 μm. Dashed box: magnified images. (B) Valve-length measure from (A). Embryos per genotype; n = 15. Kruskal-Wallis test: ∗∗p ≤ 0.009 for double mutants versus sibling or mafbb; ∗p = 0.044 mafba versus double mutants; other comparisons: ns p > 0.9999. (C) (Top) Projections of the average phenotype of siblings (n = 12), mafba mutants (n = 11), and double mutants (n = 12) in Tg(prox1a:RFP) embryos at 5dpf. Arrow: lymphatic valve; ∗: its absence. (Bottom) Overlay of siblings (green) with siblings and mafba or double mutants (magenta). Arrow: valve; ∗: absent valve. Scale bar, 50 μm. (D) Surface rendering of Tg(prox1a:RFP) showing valve structure in siblings, mafba mutants, and double mutants at 5 dpf. Fontal and lateral views. Scale bar, 10 μm. (E) Confocal imaging of Tg(fli1a:nEGFP) (yellow, endothelium), Tg(prox1a:RFP) (green), and Qtracker 665 (magenta) in the facial lymphatics at 5 dpf, in siblings and mafbb, mafba, and double mutants, 5 min post-injection. FCLV, facial collecting lymphatic valve; FLV, facial lymphatic vessel. ∗: absence of dye in FCLV. Scale bar, 50 μm. (F) Percentage of embryos with dye leakage into FCLV at 5 min post-injection in siblings (n = 17), mafbb mutants (n = 8), mafba mutants (n = 15), and double mutants (n = 6). Chi-squared; p = 0.0159. Single comparisons with Fisher’s exact test: ∗∗ p ≤ p = 0.009 for double mutants versus siblings or mafbb; ∗p = 0.0456 for mafba versus double mutants; other comparisons: ns with p ≥ 0.399. ns, non-significant; stars are significant; error bars are mean ±SD. See also Figure S2 and Video S2. |
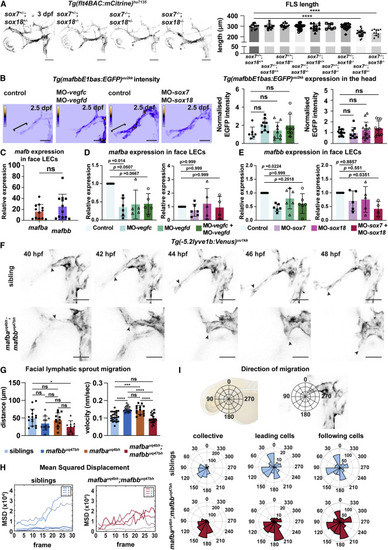
Figure 4. mafba and mafbb regulate facial LEC migration downstream of Vegfc-Vegfd-SoxF (A) (Left) Confocal images of Tg(flt4BAC:mCitrine) expression in facial lymphatics in sibling, sox7+/−;sox18−/−, sox7−/−;sox18+/−, and sox7−/−;sox18−/− embryos at 3 dpf. ∗: reduced sprout length. Scale bars, 100 μm. (Right) Quantification of facial lymphatic sprout length at 3 dpf in sox7 and sox18 mutant backgrounds. sox7+/+;sox18+/+ n = 12; sox7+/−;sox18+/+ and sox7−/−;sox18+/+ n = 13; sox7+/+;sox18+/− n = 18; sox7+/−;sox18+/− n = 30; sox7+/+;sox18−/− n = 7; sox7+/−;sox18−/− n = 17; sox7−/−;sox18+/− n = 32; sox7−/−;sox18−/− n = 11. One-way ANOVA: ∗∗∗∗p < 0.0001 for sox7+/+;sox18+/+ versus sox7−/−;sox18+/− or sox7−/−;sox18−/−; other comparisons: p > 0.9782. (B) (Top) Heatmap of Tg(mafbbE1bas:EGFP) signal intensity from confocal projection at 2.5 dpf in face LECs. Gray value intensity scale: 0–113 for control and MO-vegfc + MO-vegfd, scale: 0–147 for control and MO-sox7+MO-sox18. White bracket: quantification area. Scale bar, 50 μm. (Bottom) Quantification of Tg(mafbbE1bas:EGFP) intensity. (Left) Control n = 7; MO-vegfd and MO-vegfc n = 9; MO-vegfc + vegfd n = 8; (right) control n = 17; MO-sox7 n = 9; MO-sox18 n = 14; MO-sox7 + sox18 n = 10. Kruskal-Wallis test: ns p > 0.2372. (C) Quantitative real-time PCR of mafba and mafbb expression relative to cdh5 in facial LECs at 48 hpf. 12 replicates. Wilcoxon test: ns p = 0.3013. (D and E) Quantitative real-time PCR of mafba and mafbb expression in face LECs at 48 hpf. (D, left) 6 replicates for control and MO-vegfc and 5 for MO-vegfd and MO-vegfc + vegfd; expression relative to cdh5. (D, right) 6 replicates for control, MO-sox7, 5 for MO-sox18, and 4 for MO-sox7+MO-sox18; expression relative to B actin. (E, left) 6 replicates for control, MO-vegfd, MO-vegfc, and MO-vegfc + vegfd; expression relative to cdh5. (E, right) 6 replicates for control, 5 for MO-sox7 and MO-sox18, and 4 for MO-sox7+MO-sox18; expression relative to B actin. Kruskal-Wallis: p values reported on the graph. (F) Confocal projections from time-lapse imaging of LEC migration in siblings and double mutants labeled by Tg(-5.2lyve1b:Venus) from 40–48 hpf. Arrows: leading cells in FLS. Scale bars, 50 μm. (G) (Left) FLS migratory distance (from F). Embryos: siblings n = 15, mafbb n = 11, mafba n = 12; double mutants n = 9. One-way ANOVA: ∗p = 0.0279 for siblings versus double mutants; ns for all other comparisons. (Right) FLS migratory velocity (from F). Cells: siblings n = 24, mafbb n = 16, mafba n = 14; double mutants n = 29. One-way ANOVA: ∗∗∗∗p < 0.0001 for siblings versus mafbb, and mafbb or mafba versus double mutants; ∗∗∗p = 0.0001 for siblings versus mafba; ns for all other comparisons. (H) FLS tip mean-squared displacement (MSD) (from F) in siblings (n = 4) and double mutants (n = 4). (I) (Top) Schematic representation of directionality in the polar histograms. (Bottom) Polar histograms of migration tracked (from F) in siblings (n = 4) and double mutants (n = 4). Collective cells: siblings n = 24 and double mutants n = 29; leading cells: siblings n = 4 and double mutants n = 4; following cells: siblings n = 20 and double mutants n = 25. ns, non-significant; stars are significant; mean with SD.
|