
- Title
-
Bee pollen in zebrafish diet affects intestinal microbiota composition and skin cutaneous melanoma development
- Authors
- Di Chiacchio, I.M., Gómez-Abenza, E., Paiva, I.M., de Abreu, D.J.M., Rodríguez-Vidal, J.F., Carvalho, E.E.N., Carvalho, S.M., Solis-Murgas, L.D., Mulero, V.
- Source
- Full text @ Sci. Rep.
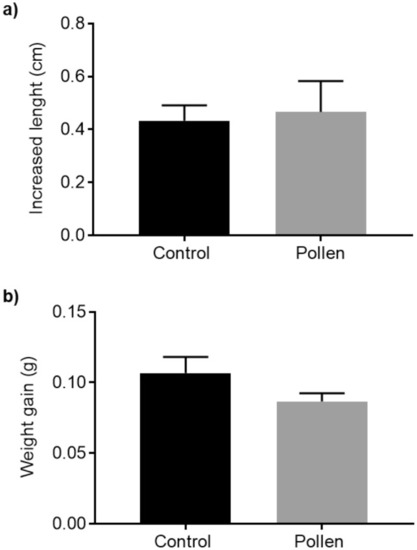
Growth parameters of adult zebrafish after feeding with control diet (black bar) vs. pollen diet (gray bar). (a) Increased length (cm). (b) Mean weight gain (g). p > 0.05 according to unpaired Student t test. The data are shown as mean + SEM (n = 24). |
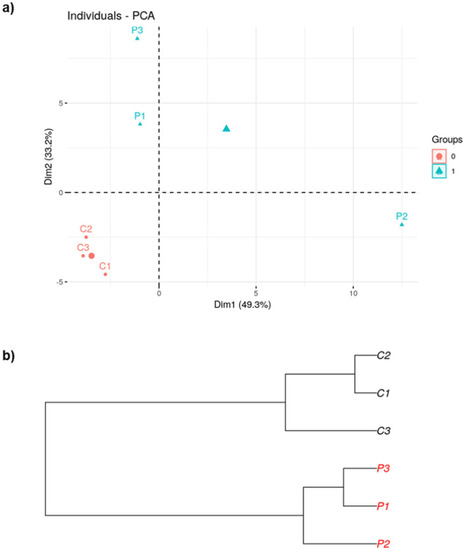
Relationship between the composition of the gut bacterial communities in zebrafish fed with control diet (C1–3) and pollen supplemented diet (P1–3). (a) Principal Component Analysis (PCA) plot. (b) Dendrogram. Generated by R Core Team 2019. |
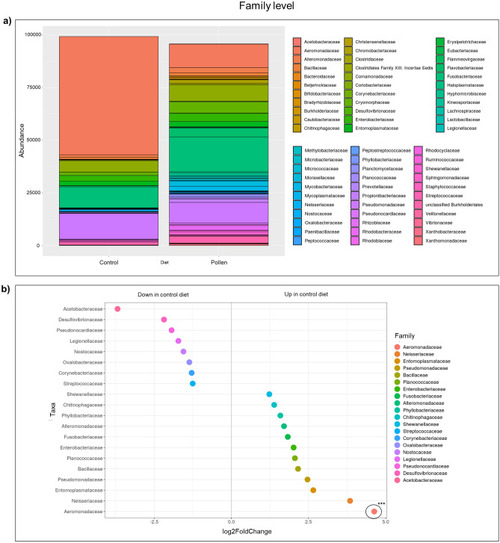
Bacterial communities at family level. (a) Stacked column bar graph showing the distribution and abundances of bacteria in zebrafish fed with control diet and pollen supplemented diet. (b) Dot plot graph showing significantly different abundant OTUs (***p < 0.001), where OTUs are grouped by color family along the y-axis. The x-axis indicates the log2 fold-change in control diet compared to pollen diet. |
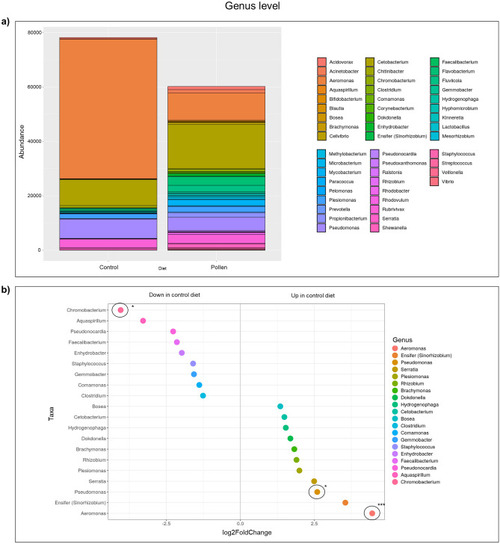
Bacterial communities at genus level. (a) Stacked column bar graph showing the distribution and abundances of bacteria in zebrafish fed with control diet and pollen supplemented diet. (b) Dot plot graph showing significantly different abundant OTUs (*p < 0.05; ***p < 0.001), where OTUs are grouped by color along the y-axis. The x-axis indicates the log2 fold-change in control diet compared to pollen diet. |
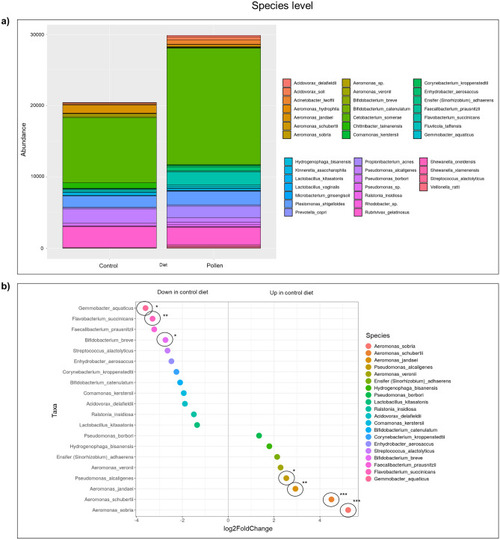
Bacterial communities at species level. (a) Stacked column bar graph showing the distribution and abundances of bacteria in zebrafish gut fed with control diet and pollen supplemented diet. (b) Dot plot graph showing significantly different abundant OTUs (*p < 0.05; **p < 0.01; ***p < 0.001), where OTUs are grouped by color along the y-axis. The x-axis indicates the log2 fold-change in control diet compared to pollen diet. |
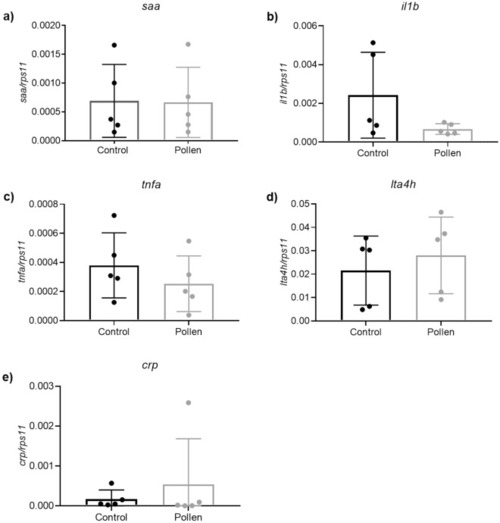
The transcript levels of genes encoding proinflammatory mediators in zebrafish intestines after diet treatments. (a) saa. (b) il1b. (c) tnfa. (d) lta4h. (e) crp. p > 0.05 according to unpaired Student t test. The data are shown as mean + SEM (n = 5). |
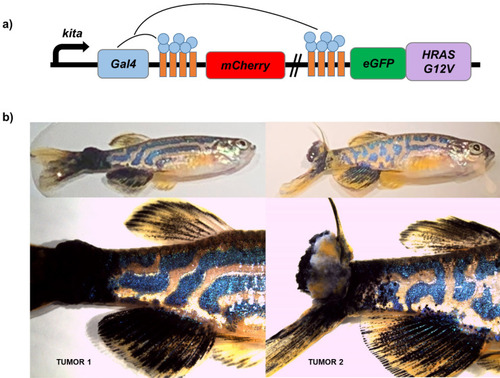
Animals used as tumor donors for transplantation. (a) Schematic diagram of SKCM model line in zebrafish. Tg (kita:GalTA4,UAS:mCherry)hzm1 zebrafish was crossed with Tg (UAS:eGFP-H-RAS_G12V)io6 line to express oncogenic human HRAS_G12V driven by the melanocyte cell-specific promoter kita. (b) Representative images of kita:Gal4;eGFP-HRAS-G12V whole fish and nodular tail tumor (1 and 2) used in our study (biopsied and disaggregated for posterior allotransplantation). |
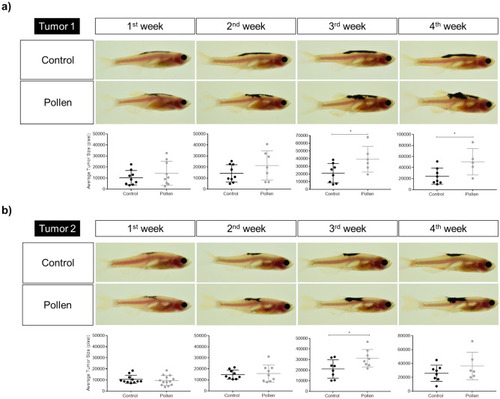
Tumors representative images and average tumor size (pixels) from 1 to 4 weeks’ post-transplant. (a) Tumor 1. (b) Tumor 2. Each dot corresponds to a recipient-transplanted fish and the mean ± SEM is also shown. *p < 0.05 according to unpaired Student t test. |
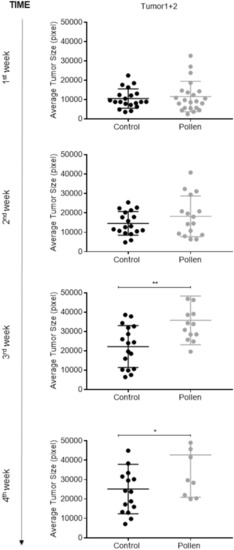
Average tumor size. Average tumor (1 + 2) size (pixels) from 1 to 4 weeks’ post-transplant. Each dot corresponds to a recipient-transplanted fish and the mean ± SEM is also shown. *p < 0.05, **p < 0.01 according to unpaired Student t test. |
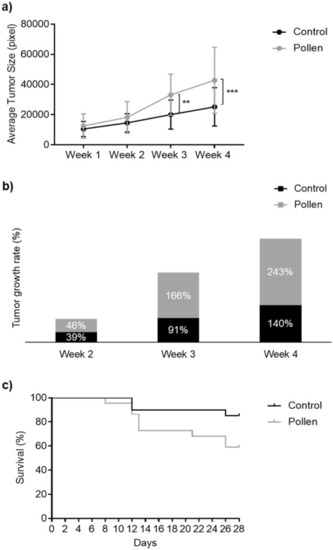
Adult casper zebrafish fed with control diet (black color) vs. pollen diet (gray color) over 4 weeks after melanoma allotransplant. (a) Average tumor (1 + 2) size (pixels). **p < 0.01; ***p < 0.001 according to ANOVA and Sidak’s Multiple Comparison Test. (b) Tumor growth rate (%). (c) Survival curve (%). Kaplan–Meier Gehan–Breslow–Wilcoxon and nonparametric Log-rank Test. |