- Title
-
Single Cell/Nucleus Transcriptomics Comparison in Zebrafish and Humans Reveals Common and Distinct Molecular Responses to Alzheimer's Disease
- Authors
- Cosacak, M.I., Bhattarai, P., De Jager, P.L., Menon, V., Tosto, G., Kizil, C.
- Source
- Full text @ Cells
|
Figure 1. Overall study scheme. Summary of the single cell dataset comparison, conclusions drawn, and respective figures. |
|
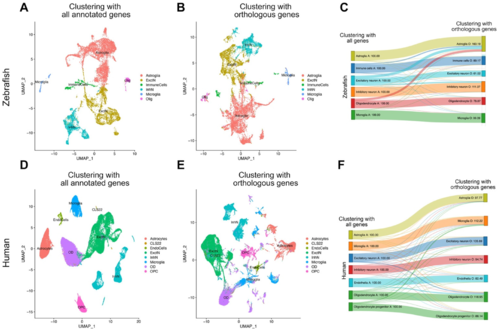
Figure 2. Transition analysis between cell clusters. (A) tSNE plot showing the main cell types in zebrafish when all genes annotated in zebrafish are used for clustering. (B) tSNE plot showing the main cell types in zebrafish when only the genes orthologous to humans are used for clustering. (C) Transition diagram between (A,B). When human orthologous genes are used, majority of the cell types remain in their clusters, with slight exception of a subset of oligodendrocytes, excitatory neurons, and inhibitory neurons that start clustering in astroglia. (D) tSNE plot showing the main cell types in humans when all genes annotated in humans are used for clustering. (E) tSNE plot showing the main cell types in humans when only the genes orthologous to zebrafish are used for clustering. (F) Transition diagram between (D,E). When zebrafish orthologous genes are used, the vast majority of the cell types remain in their clusters.
|
|
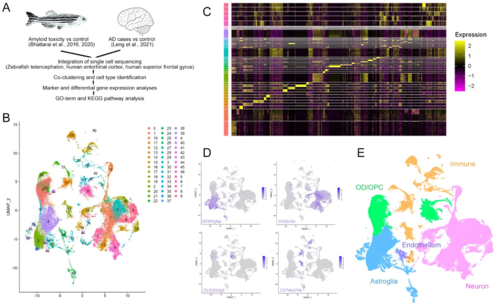
Figure 3. Integration of single cell transcriptomics data from zebrafish and human brains in AD. (A) Schematic work pipeline for integration of open-access datasets from [29,37,40,41,42,43,44,45,46,47,48,49]. (B) tSNE plot that co-localizes and clusters human and zebrafish cells. (C) Heat map of the marker genes of the identified clusters. (D) Exemplary gene expression for cell clusters: GFAP for astroglia, SV2 for neurons, OLIG2 for oligodendrocytes, and CD74 for immune cells. (E) Colored cell type identification tSNE for human and zebrafish composite single cell clustering. See Figures S1 and S2 and Data S1. |
|
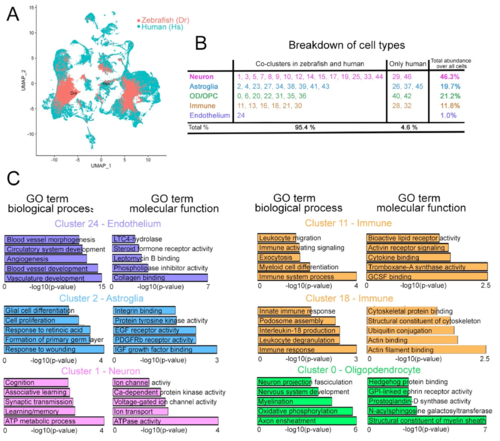
Figure 4. Analyses of the composite human–zebrafish single cell clusters. (A) Color-coded breakdown of the cells on the composite tSNE plot. Green: human cells; red: zebrafish cells. (B) Table showing the cluster numbers, identities, their co-clustering status in human and zebrafish, and the abundance of cells in those clusters. 95.4% of all cells on the composite tSNE plot can be co-clustered in humans and zebrafish. 4.6% of all cells are only in human clusters. (C) GO term enrichment graphs for the representative endothelial, neuronal, astroglial, immune, and neuronal clusters. See Figures S3 and S4, Datas S2 and S3. |
|
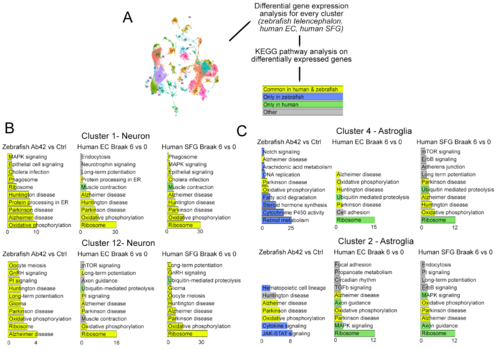
Figure 5. Analysis of the differentially expressed genes in specific cell clusters. (A) Schematic representation of the analysis pipeline. Human cell clusters from EC and SFG are compared between Braak Stage 6 and 0, and zebrafish cell clusters were compared between amyloid-beta-42 injection versus controls. The common KEGG pathways for differentially expressed genes are shown in yellow, zebrafish-specific hits are blue, and human-specific hits are in green. The other category includes the hits that are present only in one human brain region, but not in the other. (B) Neuronal and astroglial cell clusters are compared for the KEGG pathway changes. Strikingly, the neuronal clusters in human and zebrafish respond to AD in a highly similar fashion in terms of altered KEGG pathways (B), while astroglia have more species-specific responses than common (C). See Datas S4 and S5.
|
|
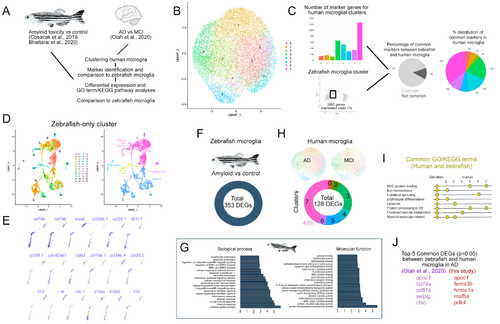
Figure 6. Comparison of human and zebrafish microglia. (A) Schematic representation of the analysis pipeline. Open access datasets from [38,40,41] (B) Clustering of the human microglia single cell sequencing data. (C) Comparison of the number of marker genes in microglial clusters, pie charts for the percentage of common marker genes of zebrafish microglia and human microglia, and the distribution of the common genes to individual human microglial clusters. (D) Clustering of zebrafish single cell sequencing dataset, both alone and color-coded tSNE plots for cell types. (E) Zebrafish immune cell clusters and representative gene expressions. (F) Differentially expressed gene analyses in zebrafish microglia and human microglia in AD. (G) Representative graphs of the biological process and molecular functions of the differentially expressed genes in zebrafish microglia in the AD model. (H) Clustering of human microglia dataset [38] from Alzheimer’s disease versus Mild cognitive impairment patients and differentially expressed gene numbers. (I) Representative GO terms and KEGG pathways that are common in human and zebrafish microglia. (J) Comparison of the top five common differentially expressed genes in zebrafish [40,41] and human microglia [38] in AD. See Datas S6–S11. |
|
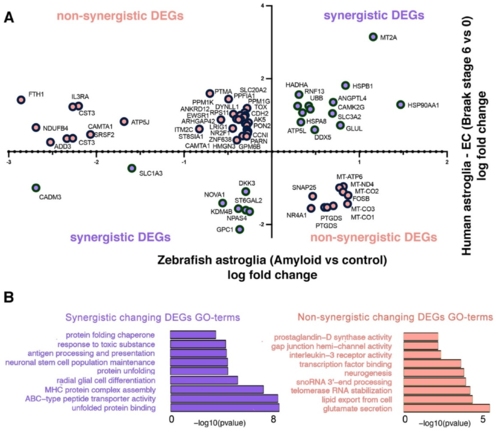
Figure 7. Comparison of differentially expressed genes in the human and zebrafish astroglia clusters. (A) Chart indicating the genes that are differentially expressed in astroglial clusters 2 and 4 in zebrafish (telencephalon, amyloid toxicity versus control) and human brains (entorhinal cortex, Braak stage 6 versus 0) when these clusters are compared within. The x-axis shows the log-fold changes for zebrafish astroglia and the y-axis denotes the log-fold changes in human astroglia. Duplicate gene names indicate their appearance in both astroglial clusters. The gene names are distributed sterically on the graph. (B) Selected GO terms for synergistically and non-synergistically differentially expressed genes in all astroglial clusters, combined. See Datas S4, S5 and S12. |


