FIGURE SUMMARY
Title

Developmental independence of median fins from the larval fin fold revises their evolutionary origin

Authors
Miyamoto, K., Kawakami, K., Tamura, K., Abe, G.
Source
Full text @ Sci. Rep.

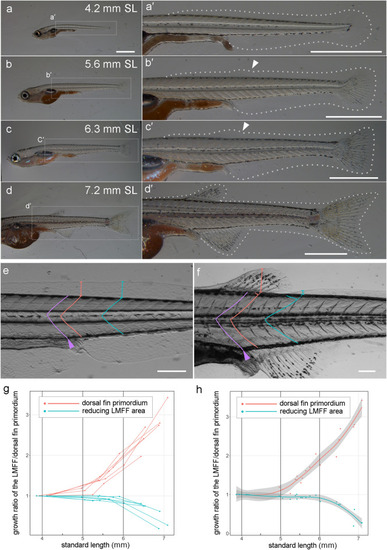
Morphological observation of dorsal fin development and LMFF reduction. (a-d') Gross anatomy of median fin development at 4.2 mm (a,a’), 5.6 mm (b,b’), 6. 3 mm (c,c’), and 7.2 mm (d,d’). The right panels (a’,b’,c’,d’) are magnified views of the dashed rectangles in the left panes (a,b,c,d), respectively. White dashed lines in (a’,b’,c’,d’) indicate outlines of the LMFF. White arrowheads in (b’,c’) indicate protrusion sites of the LMFF. (e,f) Landmark and positions used for measuring the height of the LMFF. To examine the height of the LMFF/dorsal fin primordium at the same position during ontogeny, we used the somite boundary, which is located at the gut tube bending point (purple arrowhead) as a landmark (the first boundary: purple line). Then, we measured two somite boundaries: the next somite boundary from the first boundary (red line) for the future dorsal fin position and the fifth somite boundary (blue lines) for the fin-disappearing positions, respectively. (g,h) Transition of growth ratio of the LMFF/dorsal fin primordium. Each line in (g) indicates temporal transition of the same individual. (h) Local polynomial regression fit of (g). The 95% confidence intervals are indicated as grey areas in (h). Scale bars in (a) and those in (a’,b’,c’,d’,e,f) indicate 1 mm and 200 μm, respectively.

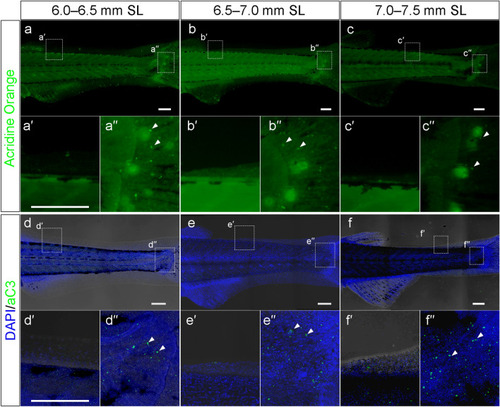
Apoptotic cell death in the reducing LMFF area. (ac’’) Acridine orange staining in the reducing LMFF area (a’,b’,c’) and proximal part of the developing caudal fin region (a”,b”,c”) at 6.0–6.5 mm SL (aa”), 6.5–7.0 mm SL (bb”), and 7.0–7.5 mm SL (cc”). The lower panels (a’,a”,b’,b”,c’,c”) are magnified views of the dashed rectangles in the upper panels (a,b,c), respectively. (df”) Expression pattern of active caspase 3 in the reducing LMFF area (d’,e’,f’) and proximal part of the developing caudal fin region (d”,e”,f”) area at 6.0–6.5 mm SL (dd”), 6.5–7.0 mm SL (ee”), and 7.0–7.5 mm SL (ff”). The lower panels (d’,d”,e’,e”,f’,f”) are magnified views of the dashed rectangles in the upper panels (d,e,f), respectively. Arrowheads in (a”,b”,c”,d”,e”,f”) indicate examples of apoptotic cell death signals. Scale bars indicate 200 μm.

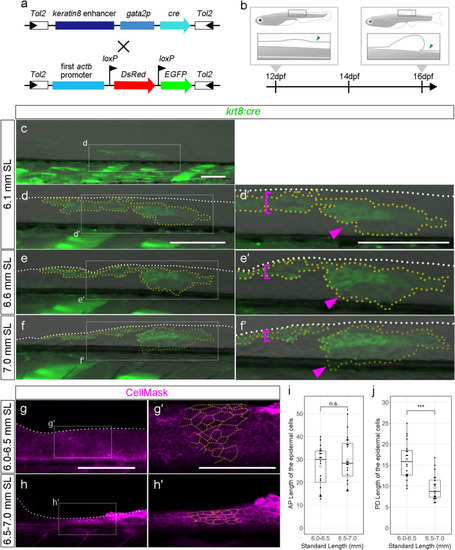
Cell-tracking analysis of the epithelial cells in the reducing LMFF area. (a) Schematic of the plasmid DNA construct used to generate the Tg. (b) Scheme of the Tg observation. (cf’) GFP-positive labelled cells in the reducing LMFF area at 6.1 mm SL (cd’), 6.6 mm SL (ee’), and 7.0 mm SL (ff’). The right panels (d’,e’,f’) are magnified views of the dashed rectangles in the left panes (d,e,f), respectively. White dashed lines in (d-f’) indicate outlines of the LMFFs. Yellow dashed lines indicate outlines of the EGFP-positive populations of epidermal cells. Magenta brackets in (d’,e’,f’) indicate EGFP-positive populations of epidermal cells experiencing proximo-distal shrinking. Magenta arrowheads in (d’,e’,f’) indicate EGFP-positive populations of epidermal cells migrating down to the trunk. (gh’) Cell morphology and distribution in the reducing LMFF area at 6.0–6.5 mm SL (gg’) and 6.5–7.0 mm SL (hh’). Cell membrane visualized by CellMask. The right panels (g’,h’) are magnified views of the dashed rectangles in the left panels (g,h), respectively. Yellow dashed lines indicate outlines of the epidermal cells. (i,j) Boxplots of cell length along the AP and PD axis in the reducing LMFF area. Whiskers in (i) and (j) show maximum and minimum values within 1.5 times the interquartile range. Boxes show the median and 25th and 75th percentiles. The P value in (i) and (j) is the result of Brunner-Munzel test (P = 0.4407 and P = 8.34e-10). Scale bars in (c,d,d’,g) and that in (g’) indicate 200 μm and 100 μm, respectively.

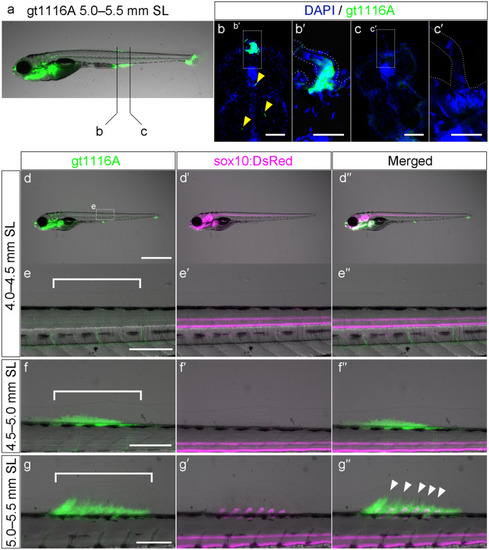
Expression pattern of UAS:EGFP in the gt1116A line and sox10:DsRed in the LMFF of double-transgenic zebrafish. (ac’) Expression pattern of UAS:EGFP of the gt1116A line in the LMFF at 5.0–5.5 mm SL. Black lines in (a) indicate levels of the section shown in (b,c). Yellow arrowheads in (b) indicate blood vessels. Expression pattern of UAS:EGFP of the gt1116A line and sox10:DsRed in the LMFF of double-transgenic fish at 4.0–4.5 mm SL (de”), at 4.5–5.0 mm SL (ff”), and 5.0–5.5 mm SL (gg”). White brackets in (e,f,g) indicate future sites of the dorsal fins. White arrowheads in (g”) indicate distal expansion of the EGFP-positive mesenchymal cell population. Scale bars in (bc’) and those in (d,e,f,g) indicate 50 μm and 200 μm, respectively.

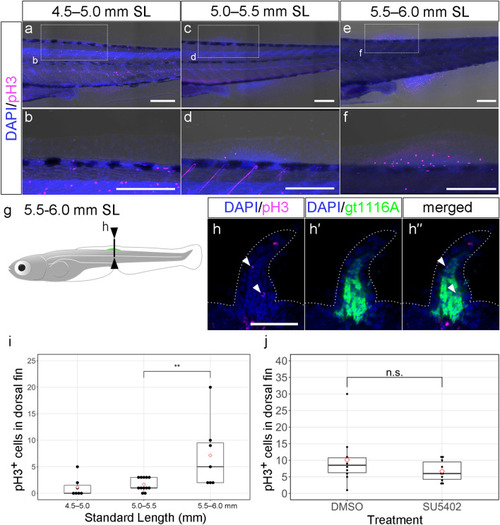
The expression pattern of phospho-histone-H3 in dorsal fin primordium. (af) Expression pattern of phospho-histone-H3 in the reducing LMFF area at 4.5–5.0 mm SL (a,b), 5.0–5.5 mm SL (c,d), and 5.5–6.0 mm SL (ef). The lower panels (b,d,f) are magnified views of the dashed rectangles in the upper panels (a,c,e), respectively. (g,h’’) The expression pattern of UAS:EGFP of the gt1116A line and phospho-histone-H3 in dorsal fin primordium at 5.5–6.0 mm SL. Black lines in (g) indicate levels of the section shown in (hh’’). Arrowheads in (h,h”) indicate phospho-histon-H3 signals. (i) Boxplots of phospho-histone-H3-positive cells in dorsal fin development along with the growth of the body. In (i), more than half of the 4.5–5.0 mm SL zebrafish samples, phospho-histone-H3-positive cells were not detect. Thus, we conducted statistical analysis only between 5.0–5.5 mm SL and 5.5–6.0 mm SL. (j) Boxplots of phospho-histone-H3-positive cells in dorsal fin development under SU5402 treatment. The proportions in (i) and (j) were calculated from the number of pH3-positive cells in dorsal fin primordium. Whiskers in (i) and (j) show maximum and minimum values within 1.5 times the interquartile range. Boxes show the median and 25th and 75th percentiles. The P value in (i) and (j) is the result of Brunner-Munzel test (P = 0.009701) and the result of Welch's t test (P = 0.2272), respectively. Scale bars in (af) and those in (h) indicate 200 μm and 50 μm, respectively.

Acknowledgments
This image is the copyrighted work of the attributed author or publisher, and ZFIN has permission only to display this image to its users. Additional permissions should be obtained from the applicable author or publisher of the image. Full text @ Sci. Rep.