
- Title
-
Notch controls the cell cycle to define leader versus follower identities during collective cell migration
- Authors
- Alhashem, Z., Feldner-Busztin, D., Revell, C., Alvarez-Garcillan Portillo, M., Camargo-Sosa, K., Richardson, J., Rocha, M., Gauert, A., Corbeaux, T., Milanetto, M., Argenton, F., Tiso, N., Kelsh, R., Prince, V.E., Bentley, K., Linker, C.
- Source
- Full text @ Elife
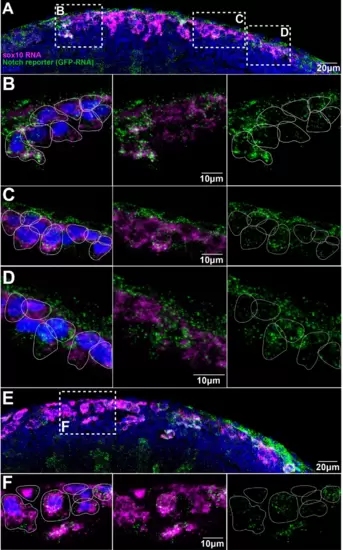
(A, E) Images of two different Notch reporter 12xNRE:egfp embryos (18 hpf) stained for sox10 (magenta) and GFP (green) RNAs, and nuclei stained with DAPI (blue). (B) Enlargement of the anterior area in (A). (C) Enlargement of the more posterior area in (A). (D) Enlargement of the anterior most posterior area in (A). (F) Enlargement of the outlined area in (E). Anterior to the left, dorsal top. White lines show approximate cell boundaries.
|
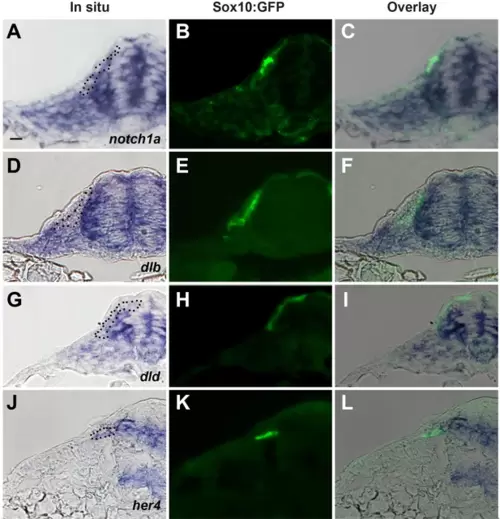
Transversal sections at trunk level of Sox10:GFP embryos showing the expression of (A–C) notch1a, (D–F) dlb (deltaB), (G–I) dld (deltaD), and (J–L) her4. (A), (D), (G), and (J) bright field, (B), (E), (H), and (K) GFP-fluorescence, and (C), (F), (I), and (L) overlay. Dotted black line in the brightfield frames indicates TNC cells seen in the fluorescent image.
|
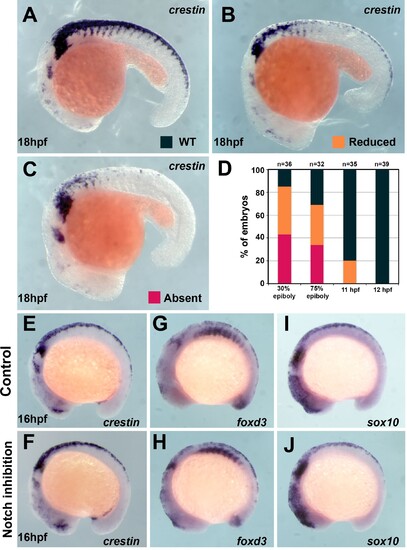
(A) crestin in situ hybridisation in wildtype (WT) embryo at 18 hpf. (B, C) crestin in situ hybridisation in DAPT-treated embryos: (B) reduced or (C) absent TNC. (D) Quantification of the crestin expression phenotypes upon DAPT treatment (phenotypes: WT, black; reduced, orange; absent, red; 30% epiboly n = 38, 75% epiboly n = 32, 11 hpf n = 35, 12 hpf n = 39). (E–J) In situ hybridisation for neural crest (NC) markers in representative control (DMSO) and DAPT-treated embryos from 12 to 16 hpf. (E, F) crestin (DMSO n = 32, DAPT n = 38), (G, H) foxd3 (DMSO n = 16, DAPT n = 35), and (I, J) sox10 (DMSO n = 27, DAPT n = 29). Anterior to the left, dorsal top.
|
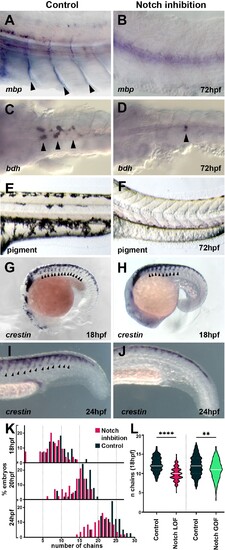
(A, B) Glial marker mbp in situ hybridisation upon (A) control (DMSO; n = 15) and (B) DAPT (n = 20) treatment from 12 hpf. (C, D) Neuronal marker bdh in situ hybridisation upon (C) control (DMSO; n = 25) and (D) DAPT (n = 18) treatment from 12 hpf. (E, F) Pigmentation upon (E) control (DMSO; n = 40) and (F) DAPT (n = 52) treatment from 12 hpf. (G, H) Neural crest marker crestin in situ hybridisation upon (G) control (DMSO) and (H) DAPT treatment from 12 to 18 hpf. (I, J) crestin in situ hybridisation upon (I) control (DMSO) and (J) DAPT treatment from 12 to 24 hpf. (K) Quantification of migratory chain formation upon control (DMSO) and DAPT treatment from 12 to 18 hpf (DMSO n = 98; DAPT n = 126), 20 hpf (DMSO n = 111; DAPT n = 109), and 24 hpf (DMSO n = 42; DAPT n = 61). (L) Quantification of migratory chain formation in control (HS:Gal4; n = 516), Notch loss of function (LOF) (HS:dnSu(H); n = 220), and gain of function (GOF) conditions (HS:Gal4xUAS:NICD; n = 142) heat shocked at 11 hpf and analysed at 18 hpf. Mann–Whitney U-test, control vs. LOF ****p<0.0001, control vs. GOF **p=0.0020. Anterior to the left, dorsal top, except in (C, D) anterior left, ventral view. Arrowheads indicate gene expression. All treatments performed from 12 hpf.
|
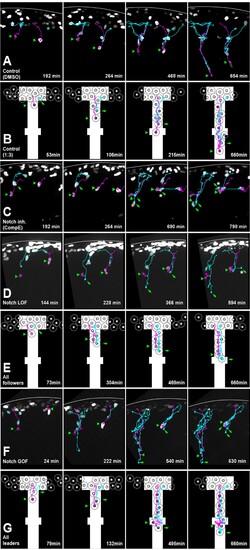
(A) Selected frames from in vivo imaging of Sox10:Kalt4 control (DMSO treated) embryos. (B) Selected frames from control simulation with 1:3 leader/follower ratio. (C) Selected frames from in vivo imaging under Notch-inhibited condition, Sox10:Kalt4 embryos treated with CompE. (D) Selected frames from in vivo imaging of Notch loss of function (LOF) condition, Sox10:Kalt4; UAS:dnSu(H) embryos. (E) Selected frames from all followers simulation. (F) Selected frames from in vivo imaging of Notch gain of function (GOF) condition Sox10:Kalt4; UAS:NICD embryos. (G) Selected frames from all leaders simulation. Magenta tracks and green arrowheads indicate leaders; green arrows and cyan tracks follower cells. Asterisks indicate cells crossing somite borders. White line marks dorsal midline. Anterior to the left, dorsal up. Time in minutes.
|
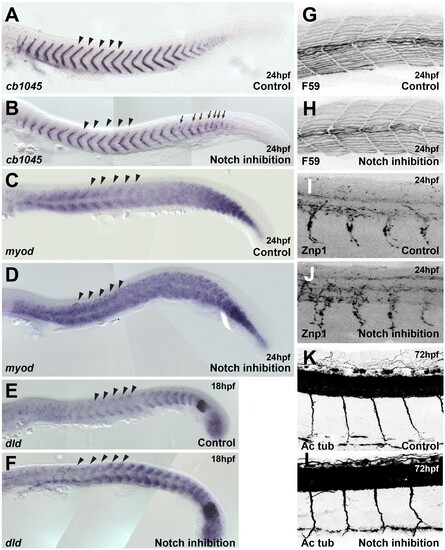
(A, B) cb1045 in situ hybridisation upon (A) control (DMSO, n = 23) and (B) DAPT (n = 30) treatment. Arrows indicate segmentation defects. (C, D) myod in situ hybridisation upon (C) control (DMSO, n = 47) and (D) DAPT (n = 45) treatment. (E, F) dld (deltaD) in situ hybridisation upon (E) control (DMSO, n = 25) and (F) DAPT (n = 30) treatment. (G, H) Antibody staining for heavy myosin (F59) upon (G) control (DMSO, n = 37) and (H) DAPT (n = 32) treatment. (I, J) Antibody staining for Znp1 upon (I) control (DMSO, n = 35) and (J) DAPT (n = 42) treatment. (K, L) Antibody staining for acetylated tubulin (Ac Tub) upon (K) control (DMSO, n = 20) and (L) DAPT (n = 27) treatment. Arrowheads indicate the level at which trunk neural crest (TNC) migration was analysed. Anterior to the left, dorsal top.
|
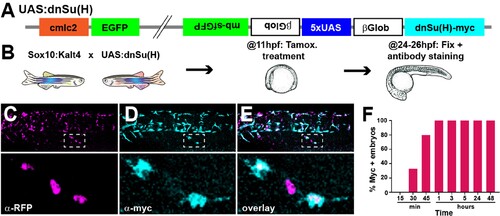
(A) Diagram of the construct used to generate the UAS:dnSu(H) line. (B) Scheme of protocol used. (C–E) Trunk region of a Sox10:Kalt4;UAS:dnSu(H) embryo treated with tamoxifen from 11 to 24 hpf and immunostained for (C) RFP and (D) myc. (E) overlay. Dotted squares indicate enlargement. (F) Number of embryos expressing the UAS driven transcripts (myc+) after tamoxifen treatment from 11 hpf for different times (15′ n = 20, 30′ n = 27, 45′ n = 25, 1 hr n = 22, 3 hr n = 18, 5 hr n = 20, 24 hr n = 14, 48 hr n = 10).
|
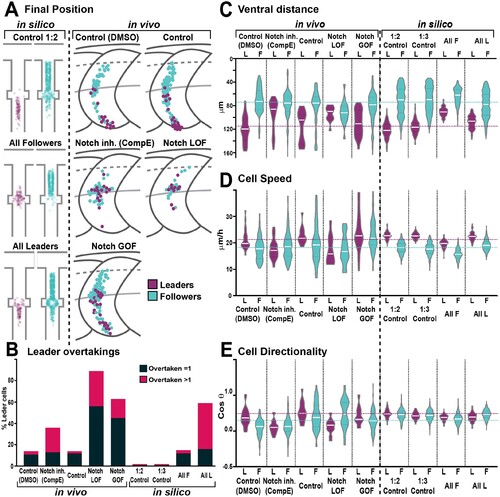
(A) Final position of each cell in model simulations and in vivo experiments under different conditions. In silico results depicted in confined pathway, in vivo data graphed in model embryo, somites contour and dorsal midline (dark grey lines), edge of the premigratory area (dashed lines), and NT/not boundary (light grey lines). Anterior left, dorsal up. (B) Quantification of leader overtaking events in vivo and in silico. Leader overtaken by a single follower is overtaken = 1; leader overtaken by more than one follower cell is overtaken >1. (C) Quantification of the ventral advance of cells in vivo and in silico. (D) Quantification of cell speed in vivo and in silico. (E) Quantification of cell directionality in vivo and in silico. Leader cells in magenta, followers in cyan. Magenta and cyan dashed lines indicate the average values for leaders and followers respectively. Full statistical analysis in Supplementary file 1.
|
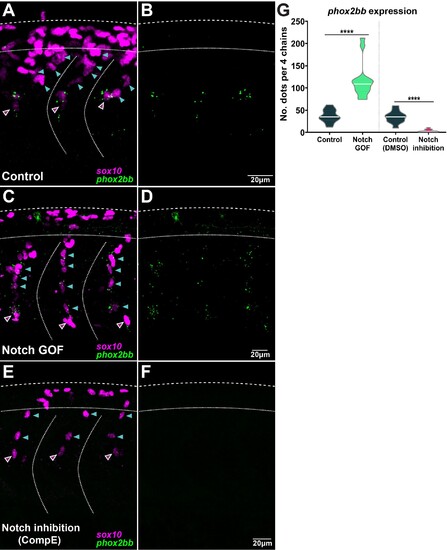
(A, B) Images of phox2bb expression in control embryos (Sox10:Kalt4). (C, D) Images of phox2bb expression under Notch gain of function (GOF) conditions (Sox10:Kalt4; UAS:NICD embryos). (E, F) Images of phox2bb expression in Notch inhibition conditions (Compound E). Magenta and cyan arrowheads indicate leaders and followers respectively. (G) Quantification of phox2bb expression in control (n = 13), Notch GOF (n = 14), and Notch inhibition conditions (n = 11). Welch’s t-test, Kalt4 control vs. GOF ****p<0.0001, DMSO control vs. inhibition ****p<0.0001.
|
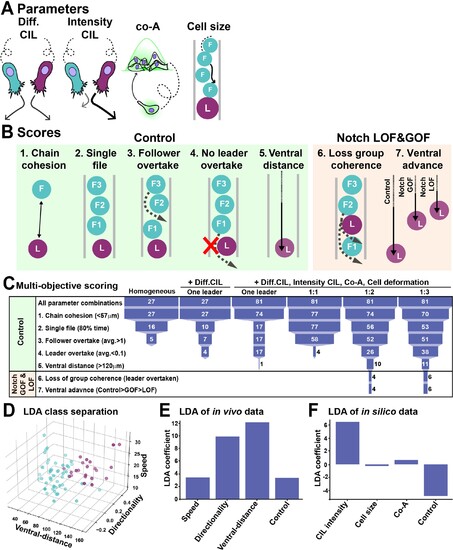
(A) Schematics of model parameters. Diff CIL: only leader/follower collisions induce repulsion and change of directionality. Intensity CIL: the leader’s response upon collision is stronger than the follower’s response. Co-A: co-attraction pulls together cells at a distance. Cell size: volume exclusion. (B) Schematics of simulations multi-objective scores. (C) Depiction of parameter space analysis showing the number of parameters sets that fulfilled each score when different variables were tested. One leader refers to chains with a single leader cell. 1:1, 1:2, and 1:3 refer to leader/follower ratios. (D) 3D plot of linear discriminant analysis (LDA). (E) LDA coefficients of in vivo data. A random dataset was used as control. (F) LDA coefficients of in silico data. A random dataset was used as control.
|
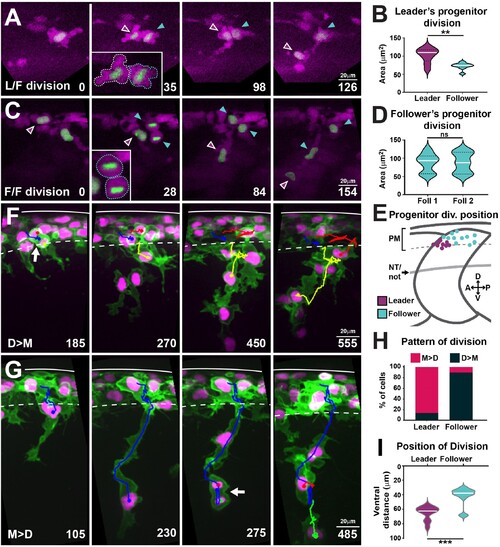
(A) Selected frames from in vivo imaging of leaders’ progenitor division in FoxD3:mCherry;H2aFVA:H2a-GFP embryos. (B) Area of leaders’ progenitor daughter cells (n = 9 cells, seven embryos; Mann–Whitney U-test, p=0.0056). (C) Selected frames from in vivo imaging of followers’ progenitor division in FoxD3:mCherry;H2aFVA:H2a-GFP embryos. (D) Area of followers’ progenitor daughter cells (n = 10, four embryos; Mann–Whitney U-test, p>0.9999). (E) Position of progenitors’ divisions on model embryo (leaders n = 9, seven embryos; followers n = 10, four embryos). PM, premigratory area; NT/not, neural tube/notochord boundary. (F) Selected frames showing the D>M division pattern from 16 to 28 hpf in vivo imaging of a Sox10:mG embryo. Blue, before division; yellow and red, after division. Arrow indicates division position. (G) Selected frames showing the M>D division pattern from 16 to 28 hpf in vivo imaging of a Sox10:mG embryo. Labelling as in (F). (H) Quantification of leaders’ (n = 21, seven embryos) and follower’s division patterns (n = 43, seven embryos). Red, M>D; black, D>M. (I) Quantification of division positions (n = 13 leaders, n = 19 followers, seven embryos; Mann–Whitney U-test, p=0.0002). Time in minutes. Leaders in magenta, followers in cyan. Anterior left, dorsal top.
|
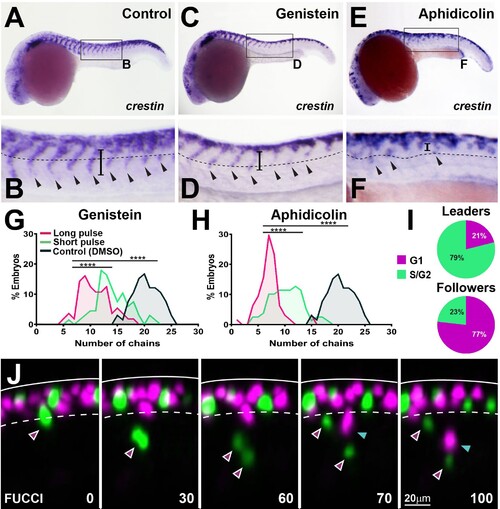
(A, C, E) crestin in situ hybridisation upon (A) DMSO, (C) genistein, or (E) aphidicolin treatment from 12 to 24 hpf. (B, D, F) Enlargement of areas indicated by boxes in (A, C, E). Dotted line marks NT/not boundary, arrowheads migratory chains, and vertical line the chain length. (G, H) Frequency distribution of migratory chains upon control (DMSO; n = 66), (G) genistein (12 hr pulse, n = 56; 6 hr pulse, n = 67), or (H) aphidicolin (12 hr, n = 64; 3 hr, n = 79). (I) Cell cycle phase at migration initiation for leaders (n = 38, four embryos) and followers (n = 43, four embryos). (J) Selected framed from in vivo imaging of Sox10:FUCCI. Time in minutes. Solid line marks dorsal midline, dotted line marks the premigratory area. Magenta arrowheads indicate leader and its daughters. Cyan arrowheads indicate followers.
|
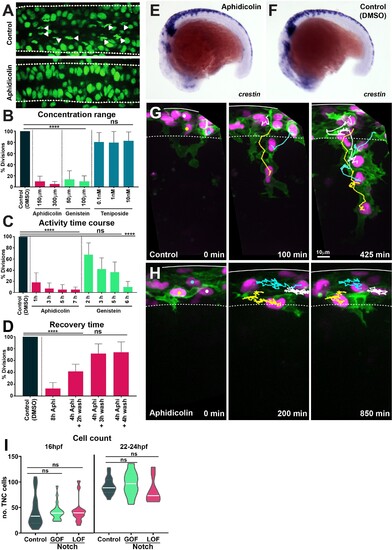
(A) Confocal images showing nuclei and mitotic figures in control (DMSO) and aphidicolin treated H2aFVA:H2a-GFP embryos. Arrowheads indicate mitotic figures; dashed lines mark the neural tube borders. Dorsal view, anterior to the left. (B) Percentage of mitotic figures in control (DMSO-treated embryos) and embryos treated with different concentrations of cell cycle inhibitors (Kruskal–Wallis test, p<0.0001, aphidicolin n = 20 and genistein n = 32; teniposide p>0.9999, n = 27). (C) Time course of the effect of cell cycle drugs (Kruskal–Wallis test, control vs. 1 hr aphidicolin p=0.0007; control vs. 3 hr, 5 hr, and 7 hr aphidicolin p<0.0001; control vs. 2 hr, 3 hr, and 5 hr genistein p>0.0892; control vs. 6 hr genistein p<0.0001; control n = 62 embryos; aphidicolin 1 hr n = 16, aphidicolin 3 hr n = 15, aphidicolin 5 hr n = 16, aphidicolin 7 hr n = 15; genistein 2 hr n = 15, genistein 3 hr n = 16, genistein 5 hr n = 17, genistein 6 hr n = 16). (D) Quantification of cell cycle recovery times following aphidicolin removal (control n = 21; aphidicolin 8 hr n = 18, aphidicolin 4 + 2 hr wash n = 15, 4 + 3 hr wash n = 15 and 4 + 4 hr wash n = 15 embryos; one-way ANOVA, control vs. 8 hr and 4 + 2 hr wash p<0.0001; control vs. 4 + 3 hr wash and 4 + 4 hr wash p>0.0851). (E, F) Whole-mount in situ hybridisation of the neural crest (NC) marker crestin in 16 hpf embryos upon (E) aphidicolin and (F) DMSO treatment from 12 hpf. Anterior to the left, dorsal top. (G, H) Selected frames of in vivo imaging from Sox10:mG embryos showing cell tracks under (G) control (DMSO) 16–28 hpf and (H) aphidicolin 16–33 hpf treatment. Solid line indicates the dorsal midline, dashed line the premigratory area; time in minutes. (I) Quantification of the number of trunk neural crest (TNC) cells per three migratory chains under control, Notch gain of function (GOF) and loss of function (LOF) conditions at either 16 hpf (control n = 25 embryos; GOF n = 21; LOF n = 14) and 22–24 hpf (control n = 18 embryos; GOF n = 18; LOF n = 9). Brown–Forsythe and Welch’s ANOVA tests, 16 hpf: control vs. GOF p>0.9999, control vs. LOF p=0.9976, GOF vs. LOF p=0.9942; 22–24 hpf: control vs. GOF p=0.8985, control vs. LOF p=0.5940, GOF vs. LOF p=0.3892.
|
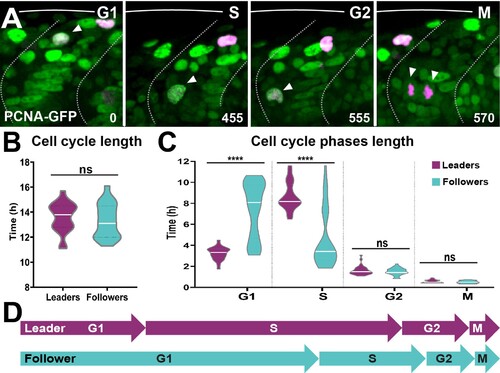
(A) Selected frames from in vivo imaging of Sox10:Kalt4 embryos from 16 to 28 hpf injected with PCNA-GFP mRNA. White arrow points to cycling cell. Time in minutes. (B) Quantification of the cell cycle total duration in leaders (n = 20, seven embryos) and followers (n = 19, seven embryos; unpaired t-test, p=0.5240). (C) Quantification of the cell cycle phases duration in leaders (G1 n = 45, S n = 44, G2 n = 33 and M n = 32, 11 embryos) and followers (G1 n = 50, S n = 48, G2 n = 33 and M n = 34, 11 embryos). Brown–Forsythe and Welch’s ANOVA tests, G1 p<0.0001, S p<0.0001, G2 p=0.9997, M p=0.9231. (D) Schematic representation of the cell cycle phases durations.
|
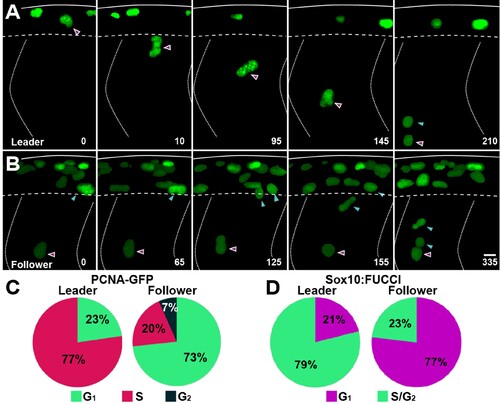
(A, B) Selected frames of in vivo imaging from Sox10:Kalt4 embryos injected with PCNA-GFP mRNA, showing PCNA localisation in trunk neural crest (TNC). (A) Leader cell initiates migration in S-phase. (B) Follower cell divides before initiating migration in G1. Solid lines indicate embryo dorsal border, dotted lines the somite borders, segmented line the premigratory ventral border. Time in minutes. Anterior to the left, dorsal up. (C) Quantification of the cell cycle phase at which cells initiate migration in PCNA-GFP mRNA injected embryos (leaders n = 22, 10 embryos; followers n = 45, 10 embryos). (D) Quantification of the cell cycle phase at which cells initiate migration in Sox10:FUCCI embryos (leaders n = 38, four embryos; followers n = 43, four embryos).
|
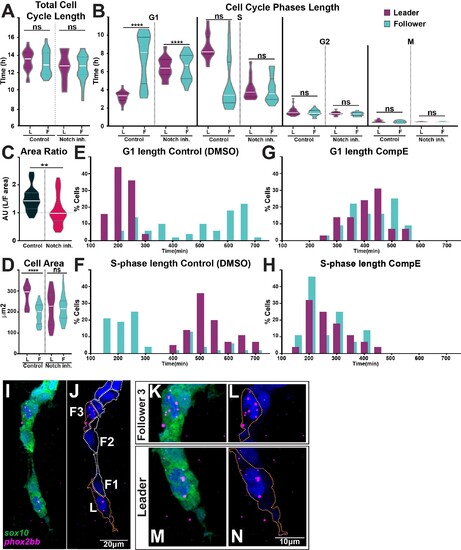
(A) Quantification of the cell cycle total duration under control (DMSO, numbers as in Figure 10B) and Notch inhibition conditions (CompE, leaders n = 17, followers n = 22, eight embryos; one-way ANOVA, p=0.1939). (B) Quantification of the cell cycle phases duration under DMSO (numbers as in Figure 10C) and Notch inhibition conditions CompE, leaders G1 n = 29, S n = 28, G2 n = 25, and M n = 25, seven embryos; followers G1 n = 32, S n = 32, G2 n = 30, and M n = 30, seven embryos; Brown–Forsythe and Welch’s ANOVA tests, all phases G1, S, G2, and M p>0.9999 between leaders and followers. (C) Quantification of cell area ratio (leaders/followers) under DMSO and Notch-inhibited conditions (n as in D; Brown–Forsythe and Welch’s ANOVA tests, DMSO control vs. CompE p= 0.0157). (D) Quantification of cell area under DMSO (leaders n = 26, followers n = 22, six embryos) and CompE conditions (leaders n = 44, followers n = 41, seven embryos). Brown–Forsythe and Welch’s ANOVA tests, DMSO leaders vs. followers p<0.0001, CompE leaders vs. followers p>0.9999. (E, F) Frequency distribution of G1- and S-phases durations in control conditions (DMSO; leaders: G1 n = 45, S n = 44, 11 embryos; followers: G1 n = 50, S n = 48, 11 embryos). (G, H) Frequency distribution of G1- and S-phases durations in Notch inhibition conditions (CompE; leaders: G1 n = 29, S n = 28, seven embryos; followers: G1 n = 32, S n = 32, seven embryos). (I–N) Images of phox2bb expression in 24 hpf Sox10:GFP embryo. (K–N) Enlargements of follower 3 and leader cells in (I, J). Orange dotted lines mark leader and third follower cell outline; white dotted lines mark followers' outline.
|
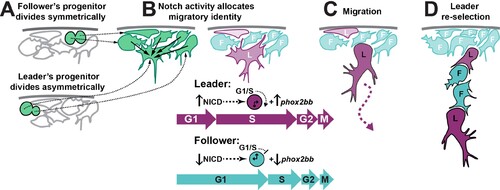
(A) Leader TNC progenitors divide asymmetrically giving rise to a prospective leader cell that is larger than the prospective followers that arise from symmetric divisions. (B) Interactions between TNC through Notch lateral inhibition establish higher levels of Notch activity in the bigger cell, triggering the initiation of S-phase and increased levels of phox2bb expression. (C) Leader cell initiated the chain movement while in S-phase trailed by followers in G1. (D) Loss of the leader contact with premigratory TNC allows for a new round of Notch interaction that establishes a second leader cell.
|