
- Title
-
Negative Elongation Factor (NELF) Inhibits Premature Granulocytic Development in Zebrafish
- Authors
- Huang, M., Ahmed, A., Wang, W., Wang, X., Ma, C., Jiang, H., Li, W., Jing, L.
- Source
- Full text @ Int. J. Mol. Sci.
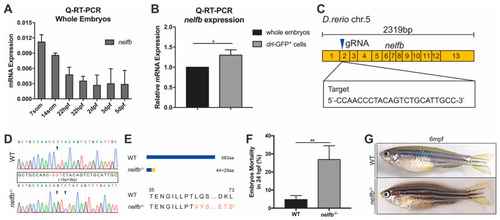
Expression of nelfb during development and generation of zebrafish nelfb mutants. (A) Q-RT-PCR analysis of whole embryos to show the expression of nelfb at different stages. The relative expression of nelfb is normalized to the expression of β-actin. (B) Q-RT-PCR analysis of the relative expression of nelfb in sorted drl-GFP+ cells compared with the whole embryo lysates at 24 hpf. (C) The schematic diagram of nelfb cDNA and the targeted region of guide RNA. The target DNA sequence is shown in the rectangle. (D) Sanger sequencing analysis of PCR fragments containing the gRNA targeted region from WT and nelfb deficient homozygotes. The deleted nucleotides are replaced by -, and the inserted nucleotides are in red, as shown in the rectangle. (E) Schematic representation and amino acid sequences of the wild type Nelfb and the predicted truncated protein. (F) The mortality rate of embryos at 24 hpf (n = 100–300 embryos per group). (G) Images of adult zebrafish at 6 mpf. All results are presented as the mean ± SD from three independent experiments (t test, * for p < 0.05, ** for p < 0.01). WT, wildtype; hpf, hours post-fertilization; mpf, months post-fertilization. EXPRESSION / LABELING:
|
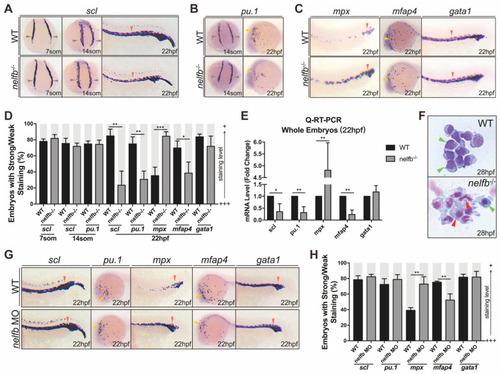
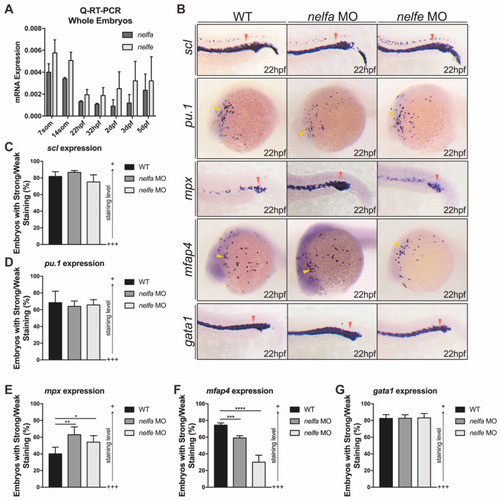
Nelfb deficiency leads to accelerated granulocytic development during primitive hematopoiesis. (A) WISH for scl in WT and nelfb−/− embryos at 7-, 14-somite stages and 22 hpf. (B) WISH for pu.1 in WT and nelfb−/− embryos at 14-somite stage and 22 hpf. (C) WISH for mpx, mfap4, and gata1 in WT and nelfb−/− embryos at 22 hpf. (D) Quantification of WISH results in (A–C) (n = 40–60 embryos per group). (E) Q-RT-PCR analysis of gene expression in nelfb−/− and WT embryos at 22 hpf. Gene expression is normalized to β-actin and presented as fold-change relative to WT. (F) May–Grünwald–Giemsa staining of peripheral blood in WT and nelfb−/− embryos at 28 hpf. Green arrowheads indicate precursors; red arrowheads indicate granulocytes. (G) WISH for scl, pu.1, mpx, mfap4, and gata1 in WT and nelfb morphants at 22 hpf. (H) Quantification of WISH results in (G) (n = 20–40 embryos per group). All results are presented as the mean ± SD from three independent experiments (t test, * for p < 0.05, ** for p < 0.01, *** for p < 0.001). Grey arrowheads, yellow arrowheads, and red arrowheads in (A–C,G), respectively, indicate ICM, ALPM, and PLPM. “+++” and “+” in (D,H) respectively represent strong staining and weak staining. WISH, whole-mount in situ hybridization; ICM, intermediate cell mass; ALPM, anterior lateral plate mesoderm; PLPM, posterior lateral plate mesoderm. EXPRESSION / LABELING:
PHENOTYPE:
|
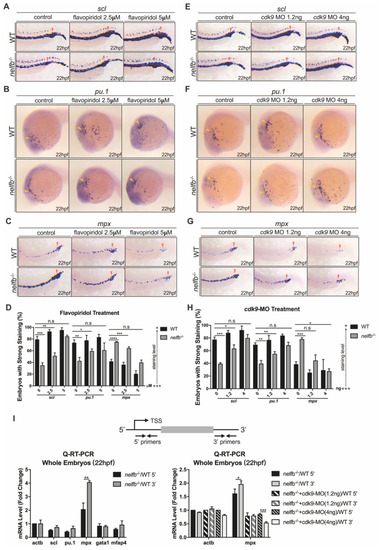
Inhibition of Pol II elongation rescues primitive hematopoiesis in nelfb−/− embryos. (A–C) WISH for scl (A), pu.1 (B) or mpx (C) at 22 hpf in WT and nelfb−/− embryos treated with DMSO, 2.5 µM flavopiridol, or 5 µM flavopiridol. (D) Quantification of WISH results in (A–C) (n = 30–50 embryos per group). (E–G) WISH for scl (E), pu.1 (F), or mpx (G) at 22 hpf in WT and nelfb−/− embryos without or with cdk9 MO injection (1.2 ng or 4 ng). (H) Quantification of WISH results in (E–G) (n = 30–50 embryos per group). (I) Upper panel shows the position of primers used in Q-RT-PCR analysis. Primers for the 5′ transcripts are located within 120 bp from transcription start site (TSS), and primers for the 3′ transcripts are in the 3′ coding region or 3′UTR. Lower-left panel shows Q-RT-PCR analysis of 5′ and 3′ transcripts of hematopoiesis-related genes in WT and nelfb−/− embryos at 22 hpf. Lower-right panel shows Q-RT-PCR analysis of 5′ and 3′ transcripts of mpx gene in 22 hpf nelfb−/− embryos without or with cdk9 MO injection (1.2 ng or 4 ng). Gene expression is normalized to the 5′ transcript of β-actin and shown as fold-change relative to WT, following the methods in the previous study [35]. All results are presented as the mean ± SD from three independent experiments (t test, * for p < 0.05, ** for p < 0.01, *** for p < 0.001, **** for p < 0.0001). Yellow arrowheads and red arrowheads in (A–C) and (E–G), respectively, indicate ALPM and PLPM. “+++” and “+” in (D,H) respectively represent strong staining and weak staining. MO, morpholino. EXPRESSION / LABELING:
PHENOTYPE:
|
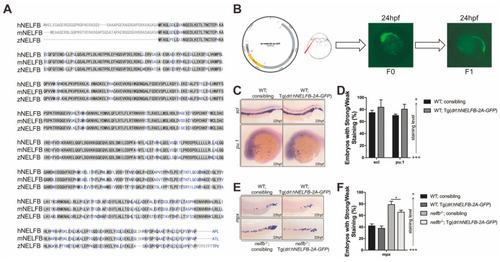
Expression of human EXPRESSION / LABELING:
PHENOTYPE:
|
Other NELF subunits play similar roles in primitive granulocytic development. ( EXPRESSION / LABELING:
PHENOTYPE:
|

Granulocytic differentiation at late developmental stages and in adulthood also shows defects in nelfb−/− zebrafish. (A) WISH for runx1 or rag1 in WT and nelfb−/− embryos at 26 hpf and 4 dpf. (B) WISH for cmyb in WT and nelfb−/− embryos at 2 dpf. (C) WISH for mpx, mfap4, and hbbe1 in WT and nelfb−/− embryos at 3 dpf. Blue arrowheads, white arrowheads, and red arrowheads, respectively, indicate AGM region, thymus, and CHT. (D) Quantification of WISH results in (A–C) (n = 30–40 embryos per group). (E) WISH for mpx at 3 dpf in WT and nelfb−/− embryos treated with flavopiridol. (F) Quantification of WISH results in (E) (n = 20–30 embryos per group). (G) WISH for mpx at 3 dpf in WT and nelfb−/− embryos injected with 1.2 ng cdk9 MO. (H) Quantification of WISH results in (H) (n = 20–30 embryos per group). (I) Q-RT-PCR analysis of 5′ and 3′ transcripts of mpx gene in WT and nelfb−/− embryos at 5 dpf. Gene expression is normalized to the 5′ transcript of β-actin and shown as fold-change relative to WT. (J) Q-RT-PCR analysis of hematopoiesis-related genes in WT and nelfb−/− mutant fish at 26 dpf. Gene expression is normalized to β-actin and presented as fold-change relative to WT. (K) May–Grünwald–Giemsa staining of WKM from WT and nelfb−/− fish at 8 mpf. Blue arrowheads, precursors; green arrowheads, intermediate myelomonocytes; yellow arrowheads, mature neutrophils; black arrowheads, lymphocytes and HSCs; red arrowheads, erythrocytes. (L) Quantification of WKM staining results. All results are presented as the mean ± SD from a representative of three independent experiments (t test, * for p < 0.05, ** for p < 0.01, *** for p < 0.001). “+++” and “+” in (D,F,H) respectively represent strong staining and weak staining. Note: dpf, days post-fertilization; mpf, months post-fertilization; AGM region, aorta-gonad-mesonephros region; CHT, caudal hematopoietic tissue; WKM, whole kidney marrow; HSCs, hematopoietic stem cells. EXPRESSION / LABELING:
|