
- Title
-
Evolutionary divergence of locomotion in two related vertebrate species
- Authors
- Rajan, G., Lafaye, J., Faini, G., Carbo-Tano, M., Duroure, K., Tanese, D., Panier, T., Candelier, R., Henninger, J., Britz, R., Judkewitz, B., Gebhardt, C., Emiliani, V., Debregeas, G., Wyart, C., Del Bene, F.
- Source
- Full text @ Cell Rep.
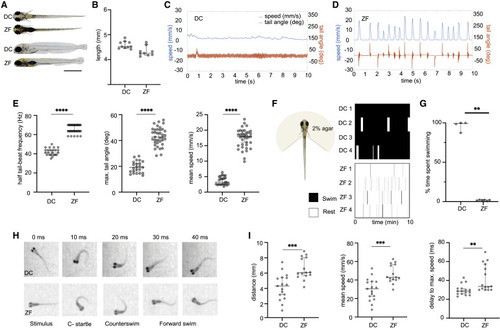
Figure 1. Kinematics of spontaneous swimming, head-embedded swimming, and escape response in DC and ZF Larval DC and ZF measure similar in size at 5 dpf. (A) A dorsal and lateral view of DC and ZF at 5 dpf is shown. (B) Measurement of body length in 5 dpf DC and ZF falls in a range of 4.1–4.9 mm. N = 10 DC; N = 9 ZF. (C and D) A comparison of swimming patterns in 6 dpf DC and ZF. It demonstrates the continuous swimming pattern in DC with lower speed (cyan) and smaller tail angle (orange) when compared with the faster discrete swimming in ZF. (E) Swimming kinematics of DC and ZF in a spontaneous swimming assay. DC utilizes lower half tail beat frequency (Hz) and lower maximum tail angles (degrees) to achieve swimming at lower speeds (mm/s) when compared with ZF (N = 23 DC, n = 494,628 half tail beats and N = 37 ZF, n = 202,176 half tail beats). (F) Tail movements in head-embedded preparations depicted in raster plots illustrate the prolonged swims of DC (top) compared with the short bouts of ZF (bottom). (G) The fraction of time spent actively swimming (percent of total acquisition time) is higher in DC compared with ZF (N = 5 DC and N = 6 ZF). (H) Qualitatively, the escape response after a tap stimulus is highly similar between DC and ZF. The images were acquired at 100 Hz. (I) Although DC covers a shorter distance at a lower mean speed, the time to achieve the maximum speed is lower in DC compared with ZF (DC, N = 19 fish, n = 141 events; ZF, N = 15 fish, n = 159 events). ∗∗p < 0.01, ∗∗∗p = 0.001, ∗∗∗∗p < 0.0001; Mann-Whitney test. All error bars show 95% confidence interval. See also Figure S1. |
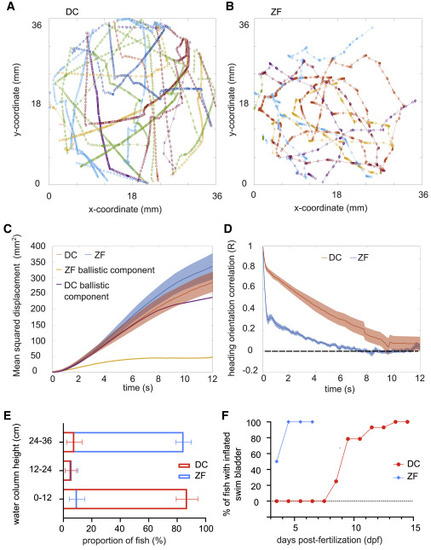
Figure 2. Long-term exploratory kinematics of DC and ZF (A and B) A few tens of swim trajectories depicted in different colors from a single DC and ZF larva, respectively. (C) Mean squared displacement (MSD) in DC and ZF over time. The MSD over time for the ballistic component of DC and ZF is also overlapped on the plot. N = 23 DT and 37 ZF. The error bars show SEM. (D) Decorrelation in heading persistence over time. R = 1 indicates a perfect persistence in head direction, whereas R = 0 corresponds to a dull randomization. In ZF, R drops rapidly, whereas this drop happens over longer period of time in DC. Hence, exploratory swimming in DC has a longer ballistic phase. N = 23 DT and 37 ZF. The error bars show SEM. (E) DC larvae occupy the bottom of the water column, whereas ZF larvae occupy the top. N = ∼30 fish and n = 10 readings in 3 replicates for each fish species. The error bars show 95% confidence interval. (F) Swim bladder inflation in ZF occurs earlier than in DC. The inflation of swim bladder in ZF occurs by ∼ 4–5 dpf, whereas DC inflates their swim bladder between ∼10 and ∼15 dpf. Sampled from a growing population of approximately N = 30 DC and 30 ZF. See also Figures S2. |
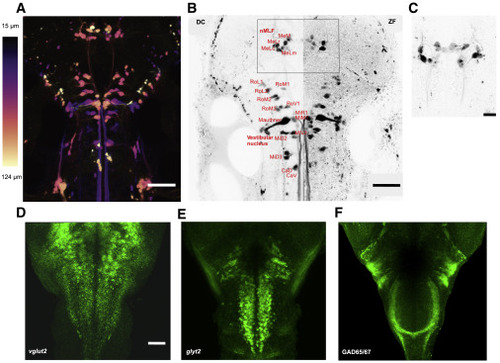
Figure 3. Distribution of reticulospinal neurons and excitatory and inhibitory neuronal cell types in the hindbrain of DC and ZF (A) Distribution of reticulospinal (RS) neurons in the brainstem of DC. Maximum intensity is color coded for depth. Scale bar, 100 μm. (B) Comparison of RS neurons in DC and ZF. A cell-to-cell comparison of RS neurons in a maximum intensity projection of RS neurons in DC and ZF. The RS neurons in DC are annotated based on the description of RS neurons in ZF (Kimmel et al., 1982; Orger et al., 2008). A high degree of conservation is observed. Scale bar, 100 μm. (C) A closer look at the rectangular region of interest (ROI) from (B) in another DC fish. Maximum intensity projection of the nucleus of the medial longitudinal fasciculus (nMLF) in another DC fish is shown. Contralateral dendritic projections are observed in DC as noted in ZF (Kimmel et al., 1982). Scale bar, 30 μm. (D–F) Distribution of (D) glutamatergic, (E) glycinergic, and (F) GABAergic neurons in the hindbrain of DC. Performed using in situ hybridization (ISH) and immunohistochemistry (IHC). Rostrocaudally running striped pattern of these neuronal types is observed in DC as noted in ZF before (Higashijima et al., 2004). Anti-vglut2a + anti-vglut2b ISH and anti-glyt2 ISH in (D and E), respectively. Anti-GAD65/67 IHC in (F). All images are a maximum intensity projection. Scale bar, 50 μm. See also Figure S3. |
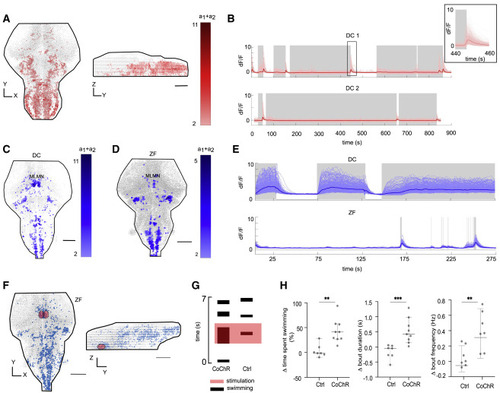
Figure 4. Neurons correlated with termination of swimming (in DC) and swimming (in DC and ZF); and holographic stimulation of the identified mesencephalic locomotion maintenance neurons (MLMNs) (A) Representative images of stop cells (in red) identified in the DC hindbrain (N = 3 fish). (B) The activity of the identified stop neurons (in red) with respect to swimming activity (in gray). The inset shows a magnified region around a swim termination event. (C and D) A representative figure of a maximum projection of neuronal correlates of swimming (in blue) identified in the DC and ZF brain, respectively. The nuclei correlated with swimming appear to be conserved between DC (N = 4 fish) and ZF (N = 4 fish). The MLMN population is labeled. (E) Neuronal activity of all the swimming correlated neurons in DC compared with the corresponding neurons’ activity in a ZF for a duration of 300 s. The activity in the conserved nuclei in DC is sustained for long durations unlike ZF, correlating with their long swim events. The gray shaded regions represent active swimming. (F) The region of interest (ROI) for holographic optogenetic stimulation is illustrated. MLMN population described in (C and D) was first anatomically located under a 2-photon microscope using expression of CoChR-GFP (in test) or GCaMP6 (in control) as the guidance cue. A holographic stimulation protocol was then employed in this ROI (see Figures S4A–S4C). (G) The result of the stimulation in a CoChR and Ctrl fish. Swimming activity in CoChR fish is increased during the holographic stimulation. (H) Change in total swimming time, bout duration, and bout frequency during optogenetic stimulation. The time spent swimming is prolonged in test fish by the optogenetic stimulation; this increase is caused by both, an increased recruitment of bouts and an increase in the duration of the bouts. N = 7 Ctrl ZF and 9 CoChR ZF. ∗∗p < 0.01, ∗∗∗p = 0.001; Mann-Whitney test. All error bars show 95% confidence interval. Scale bars, 100 μm. See also Figures S3 and S4. |