
- Title
-
Noise-induced hearing loss in zebrafish model: Characterization of tonotopy and sex-based differences
- Authors
- Han, E., Lee, D.H., Park, S., Rah, Y.C., Park, H.C., Choi, J.W., Choi, J.
- Source
- Full text @ Hear. Res.
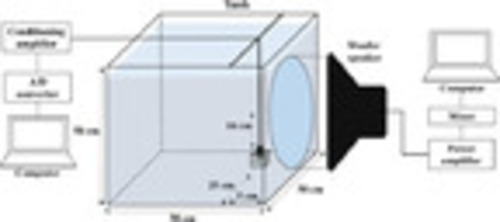
Fig. 1. Schematic representation of the experimental setup for studying noise-induced hearing loss. The zebrafish were placed 5 cm away from the center of the woofer speaker and 16 cm below it. |
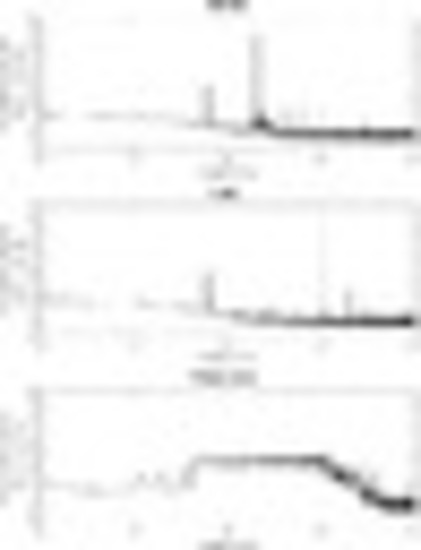
Fig. 2. Power spectral densities for 200 Hz continuous wave (CW), 1 kHz CW, and white-noise at the hydrophone position. |
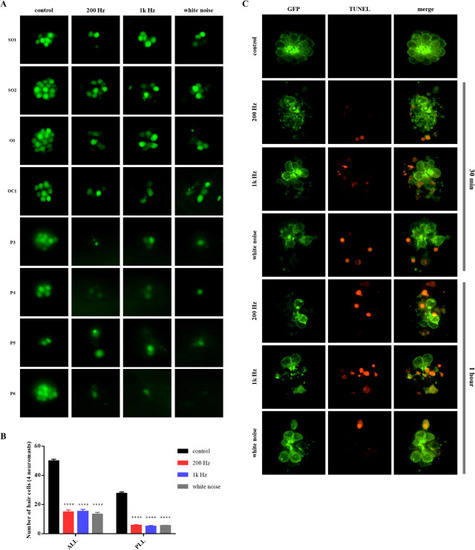
Fig. 3. Noise-induced lateral line hair cell damage of larvae. A) Fluorescence images of neuromasts of 5 dpf (days post fertilization) larvae after 1 h of noise exposure. Three different frequencies were used to cause noise-induced hair cell damage (200 Hz, 1 kHz, and white noise, 140 dB). Eight neuromasts per larva were imaged for hair cell damage analysis (SO1, SO2, O1, OC1, P3 P4, P5, and P6). B) Mean hair cell number ± standard error of the mean in zebrafish lateral line. Each neuromast was classified as belonging to the ALL (anterior lateral line) or PLL (posterior lateral line), based on its position (ALL: SO1, SO2, O1, and OC1; PLL: P3, P4, P5, and P6). The number of hair cells decreased regardless of noise frequency in all noise-exposed groups. C) Confocal images of terminal deoxynucleotidyl transferase-mediated dUTP-biotin nick-end labeling (TUNEL)-stained neuromast (O1) post-noise exposure. TUNEL-positive cells were detected in the groups exposed for both 30 min and 1 h. n = 30 for each group. |
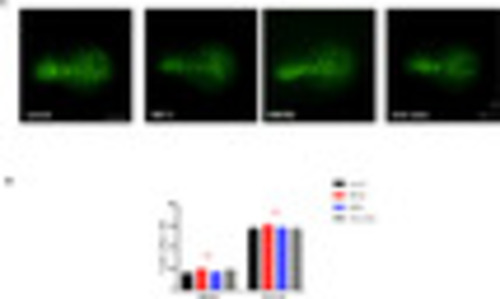
Fig. 4. Noise-induced inner ear damage of larvae. A) Saccules of 5 dpf larvae. Four groups of tg(Brn3C-gfp) larvae were exposed to 3 different frequencies of noise (200 Hz, 1 kHz, and white noise, 140 dB) for 6 h. B) Number of hair cells in the saccule of each noise-exposed larva. The saccule was divided into 2 regions (anterior: small circular structure positioned at the rostral region; posterior: large circular structure positioned at the caudal region). There were no significant differences between the different frequency-exposed groups in both regions. Scale bar: 20 μm. R: rostral. D: dorsal. n = 40. |
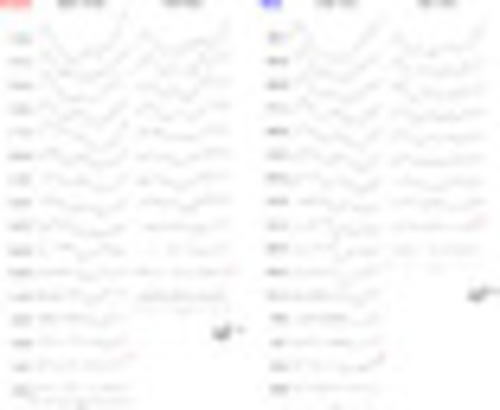
Fig. 5. Examples of auditory-evoked potential (AEP) waveforms to track the response to a 1000 Hz tone stimulus. Adult zebrafish were classified by sex, and their AEP thresholds were measured before noise exposure. These individuals were then exposed to noise for 6 h, and their AEP thresholds were measured again 24 h after noise exposure. Both females and males showed an increase in the hearing threshold after noise exposure. Red asterisk: hearing threshold. |
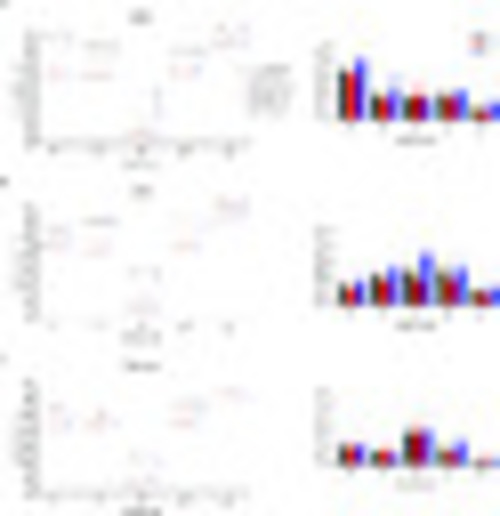
Fig. 6. Post-noise exposure changes in auditory threshold based on frequency. Left: mean threshold ± standard error of the mean. High-brightness symbols indicate the threshold before noise exposure and low-brightness symbols indicate the threshold after noise exposure. Right: pre- and post-treatment differences in the auditory threshold. Analyses of A) 200 Hz noise-treated fish, B) 1 kHz noise-treated fish, and C) fish treated with white noise showed that the auditory threshold increased regardless of sex. More threshold shifts were seen at the exposed frequencies. Furthermore, male zebrafish were more affected by noise and showed a wider variation in threshold shift than female zebrafish. n = 12 for each group. |
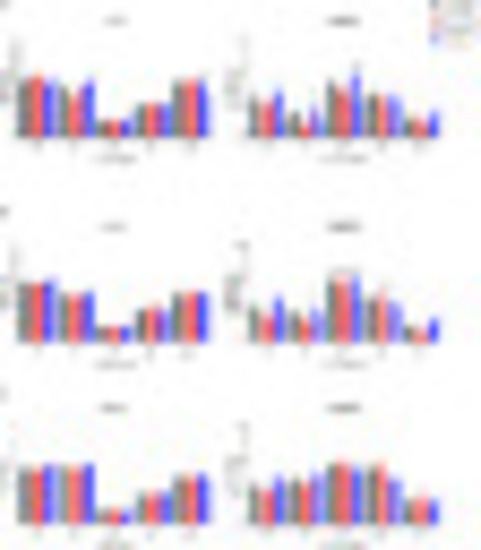
Fig. 7. Detailed analysis of AEP waveform in response to a 146 dB stimulus. Reaction velocity (latency) was evaluated in terms of the time of peak onset. The amplitude of the reaction peak was used to evaluate the scale of the reaction. A) 200 Hz-treated fish, B) 1 kHz-treated fish, and C) fish treated with white noise. Although the 200 Hz-treated group showed delayed reaction in frequency measurement, there was no change in the reaction velocity in general, with no frequency specificity. |
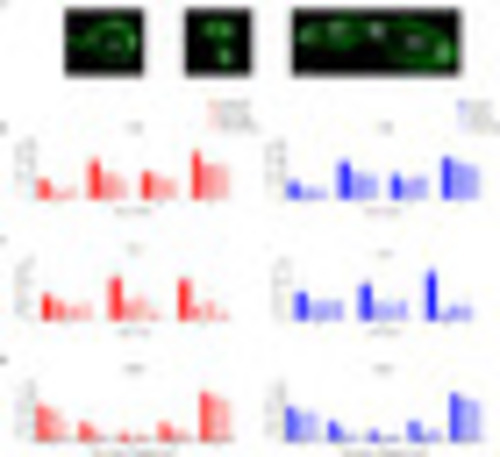
Fig. 8. Number of hair cells in the inner ear organs of adult zebrafish. A) Regions of the inner ear used for hair cell counting, and images of the utricle, lagena, and saccule, from left to right. (B–D) The number of hair cells in each region was compared among three groups exposed to different frequencies. Although the (B) utricle and (C) lagena are known to function as vestibular organs, the hair cells of these organs were also found to be damaged by noise. In the (D) saccule, female zebrafish showed statistically significant but little decrease in the number of hair cells only in the white-noise-exposed group. In contrast, male zebrafish showed frequency-specific damaged regions, that is, low frequency caused damage to the caudal region, whereas high frequency caused damage to the rostral region. n = 40. Scale bar: 50 µm. |
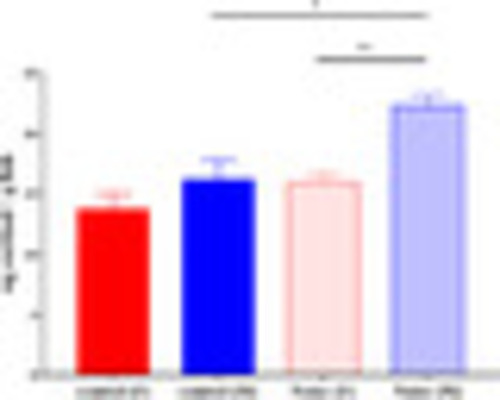
Fig. 9. Cortisol levels in noise-exposed adult zebrafish. Amounts of cortisol in the blood of noise-exposed adult zebrafish were measured in the different sex groups. The control group did not show significant differences between the sexes. However, the noise-treated male group demonstrated an increase in cortisol levels. The increased levels of cortisol in the noise-treated male group were significantly different than those in both the control group (male) and the noise-treated female group. n = 8 for each group. |
Reprinted from Hearing Research, 418, Han, E., Lee, D.H., Park, S., Rah, Y.C., Park, H.C., Choi, J.W., Choi, J., Noise-induced hearing loss in zebrafish model: Characterization of tonotopy and sex-based differences, 108485, Copyright (2022) with permission from Elsevier. Full text @ Hear. Res.