
FIGURE SUMMARY
- Title
-
The zebrafish cohesin protein Sgo1 is required for cardiac function and eye development
- Authors
- Kamel, S.M., Broekman, S., Tessadori, F., van Wijk, E., Bakkers, J.
- Source
- Full text @ Dev. Dyn.
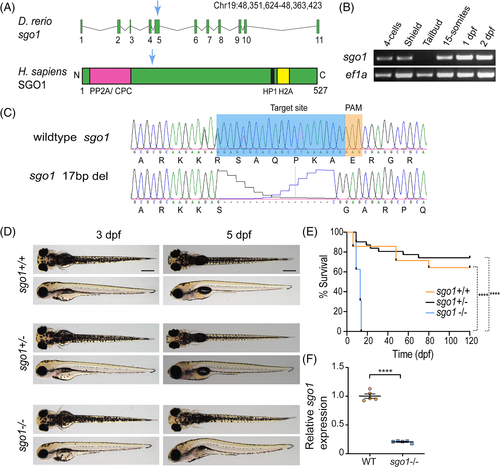
The generation of sgo1 mutant in zebrafish. (A) sgo1 transcript in zebrafish (Danio rerio) displaying the exons and intron regions. Human (Homo sapiens) SGO1 protein, containing 527 amino acids, and binding regions: protein phosphatase 2 (PP2A), chromosome passenger complex (CPC), heterochromatin protein 1 (HP1), and histone H2A (H2A). Blue arrow shows the location of the generated mutant in exon 5. (B) RT-PCR for sgo1 and ef1a (control) at various developmental stages. (C) CRISPR/Cas9 design for the introduction of a loss-of-function mutation in sgo1. The mutated sequence shows a 17 bp deletion in exon 5, resulting in an early stop in the mutated sequence and truncation of the protein (not shown). (D) Top and side images of 5 dpf larvae of sgo1−/−, sgo1+/− and their wild-type siblings. (E) Kaplan–Meier curve, displaying the survival of sgo1 −/−, sgo1+/− and their wild-type siblings during the first 120 dpf of development (sgo1+/+ n = 14, sgo1+/− n = 30, sgo1−/− n = 16). (F) Levels of sgo1 expression in sgo1 mutant embryos (n = 5) in comparison with wild type siblings (n = 5). Statistics: (E) Log-rank (Mantel–Cox) test, mean ± SEM; (F) Two-tailed nonpaired Student's t-test, mean ± SD; P ≤ .0001. Scale bars is at 200 μm. bp: base pairs, PAM: protospacer adjacent motif, dpf: days post fertilization
PHENOTYPE:
|
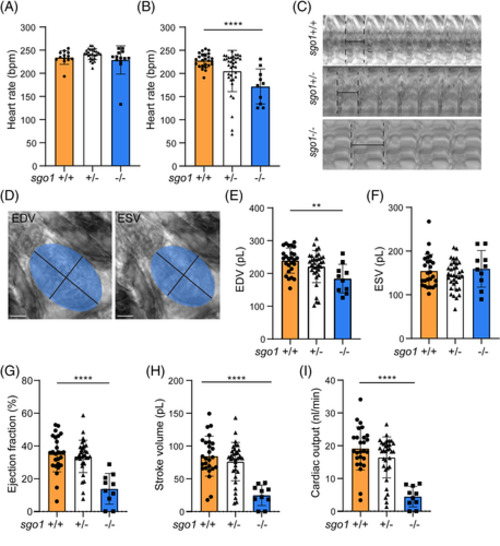
sgo1−/− show functional heart defects at 5 dpf. (A) Heart rate measurements in sgo1+/+, sgo1+/−, and sgo1−/− larvae at 3 dpf (sgo1+/+ n = 13, sgo1+/− n = 26, sgo1−/− n = 13). (B) Heart rate measurements in wild type, heterozygous carriers and homozygous mutant larvae (5 dpf; sgo1+/+ n = 25, sgo1+/− n = 36, sgo1−/− n = 10). (C) Kymograph of beat-to-beat distances in wild-type, heterozygous carriers and homozygous mutant larvae (5 dpf). (D) Sample images of the ellipse taken at end diastolic volume (EDV) and end systolic volume (ESV). Measurements using EDV/ESV ellipse methods for wild-type, heterozygous carriers and homozygous mutants at 5 dpf include: (E) EDV, (F) ESV, (G) ejection fraction (EF), (H) stroke volume (SV), and (I) cardiac output (CO). All measurements were performed in two biological replicates. Statistics: mean ± SEM, P ≤ .05, ***P ≤ .001, ****P ≤ .0001, n.s. P > .05, one-way ANOVA. Bmp: beats per minute, pL: picoliter, nL/min: nanoliter per minute, mm2: square millimeter
PHENOTYPE:
|
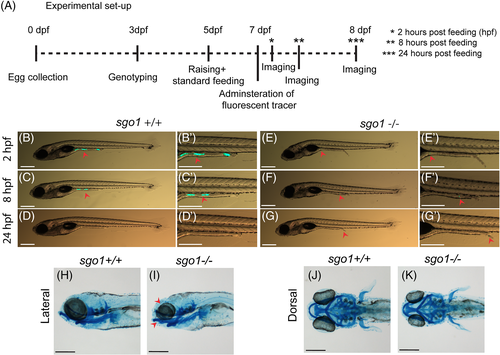
Gastrointestinal defects are not observed in sgo1 homozygous mutant larvae. (A) A schematic presentation of the intestinal transit assay experimental set up. (B–G) Representative images of 7-8 dpf larvae at different time points after feeding with fluorescently labelled tracer. Images of the same larvae at different time points are shown. Red arrowheads point to the fluorescently labelled tracer (sgo1+/+ n = 10, sgo1−/− n = 10). (H–K) Lateral and dorsal view of Alcian Blue staining in 5 dpf larvae (sgo1+/+ n = 20, sgo1−/− n = 21). Scale bars: 200 μm, taken at a magnification of 3.2× for (B–G) and at a magnification of 0.5× for (H–K). dpf: days post fertilization, hpf: hours post feeding
|
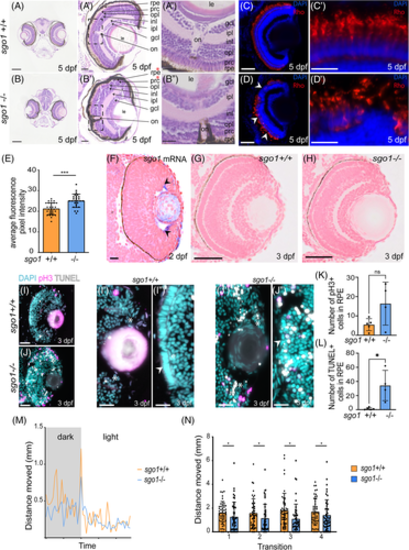
sgo1−/− larvae display morphological defects in the eye, accompanied with slow motility and reduced sensitivity to light/dark cycle. (A, B) Images of wild type and mutants H&E transverse sections of the zebrafish at 5 dpf showing the layers and components of the eye, zoom in of both eyes are shown. rpe: retinal pigmented epithelium, prc: photoreceptor cell layer, opl: outer plexiform layer, inl: inner nuclear layer, ipl: inner plexiform layer, gcl: ganglion cell layer, on: optic nerve and le: lens. Red stars denote the Retinal pigmented epithelia and photoreceptor layer that has been disrupted in the mutants (sgo1+/+ n = 6, sgo1−/− n = 6). (C,D) Rhodopsin labeling in retinal cryosections of 5 dpf sgo1+/+ and sgo1−/− larvae. (C′,D′) Higher magnifications of retinal regions labeled with Rhodopsin labeling in sgo1+/+ and sgo1−/− larvae. (E) Quantification of Rhodopsin localization to the photoreceptor cell bodies of 5 dpf sgo1+/+ and sgo1−/− larvae (sgo1+/+ n = 24, sgo1−/− n = 24). (F) Transverse section of sgo1 in situ hybridization on sgo1+/+ embryo (2 dpf; n = 6). Black arrows showing the expression in the ciliary marginal zone (cmz). (G,H) Transverse section of sgo1+/+ and sgo1−/− embryos at 3 dpf. (I,J) Combined mitotic marker (pH3) and TUNEL assay for cell death is shown for 3 dpf sgo1+/+ and sgo1−/− larvae (sgo1+/+ n = 5, sgo1−/− n = 4). (I′,J") Zoom-in images of retinal regions in sgo1+/+ and sgo1−/− larvae, stem cell niche area is shown with asterisks. (K,L) Quantification of pH 3+ and TUNEL+ cells in RPE of 3 dpf sgo1+/+ and sgo1−/− larvae (sgo1+/+ n = 5 and sgo1−/− n = 4). (M,N) Visual function recorded by visual motor behavioral assay showing the distance moved by the larvae in both groups during light ON transitions. (M) Average one light ON response recorded in 5 dpf sgo1−/− and sgo1+/+ larva (sgo1+/+ n = 48, sgo1−/− n = 48). The grey region represents the period in darkness; the white region represents the period in light. (N) The total distance moved by larvae of both groups during the first second after four consecutive light ON transitions. Functional measurements were performed in two biological replicates. Each data point represents a single larva (sgo1+/+ n = 48, sgo1−/− n = 48). Scale bar is at 200 μm for tile scan images taken at a magnification of 20×, and 25 μm for zoom-in of eye at a magnification of 40× (for A–D). Photoreceptor cell images in C′,D′ were taken at a magnification of 63× with a scale bar of 25 μm. Retinal image in F was taken at a magnification of 63x with a scale bar of 10 μm. Retinal image in G and H were taken at a magnification of 40× with a scale bar of 20 μm. Retinal images in I and J were taken at a magnification of 40× with a scale bar of 50 μm. Retinal images in I′,I″, J', and J" were taken at a magnification of 40× with a with a 200% digital zoom in and scale bar of 10 μm. Statistics: mean ± SEM,***P ≤ .001, n.s. P > .05, unpaired Students t-test. S: seconds, mm: millimeter
PHENOTYPE:
|

Unillustrated author statements PHENOTYPE:
|
Acknowledgments
This image is the copyrighted work of the attributed author or publisher, and
ZFIN has permission only to display this image to its users.
Additional permissions should be obtained from the applicable author or publisher of the image.
Full text @ Dev. Dyn.