
- Title
-
Tension-dependent stabilization of E-cadherin limits cell-cell contact expansion in zebrafish germ-layer progenitor cells
- Authors
- Slováková, J., Sikora, M., Arslan, F.N., Caballero-Mancebo, S., Krens, S.F.G., Kaufmann, W.A., Merrin, J., Heisenberg, C.P.
- Source
- Full text @ Proc. Natl. Acad. Sci. USA
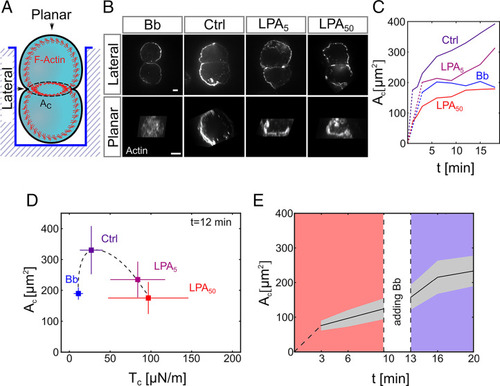
Cortical tension limits contact expansion in cell doublets. (A) Schematic of the experimental setup for live imaging of progenitor cell doublets. Doublets were placed in polymeric wells for maintaining their contact within the focal plane while being imaged from the bottom. (B) Planar and lateral views of the actin cell cortex in progenitor cell doublets (10-min contact time) visualized by Phalloidin (F-actin) in control (Ctrl) doublets and doublets exposed to Bb (10 μM) or LPA (5 and 50 nM). (Scale bar: 5 μm.) (C) Cell–cell contact size (Ac) as a function of contact time in control doublets, doublets exposed to Bb (10 μM), or different concentrations of LPA (1 to 50 nM). Dotted lines connect contact formation (0 min) with the first time point when data were collected. Error bars (SD) are shown in SI Appendix, Fig. S1. Ctrl: N = 9, n = (1 min: 30, 2 min: 26, 3 min: 30, 6 min: 24, 9 min: 24, 12 min: 24, 15 min: 22, 18 min: 22); LPA5: N = 1, n = 10 (for each time point); Bb: n = 1, n = (3 for each time point); LPA50: N = 7, n = (1 min: 32, 2 min: 32, 3 min: 33, 6 min: 21, 9 min: 21, 12 min: 21, 15 min: 21, 18 min: 20). (D) Cell–cell contact size (Ac) at 12-min contact time for control doublets and doublets exposed to Bb (10 μM) or different amounts of LPA (5 to 50 nM) plotted against cortical tension (Tc) values measured by AFM. Error bars denote SD. For Tc measurements, N = 3, (single-cell Ctrl) n = 287, (single-cell Bb) n = 88, (single-cell LPA5) n =142, and (single-cell LPA50) n = 294. For Ac measurements, N and n are the same as in C (time point 12 min). (E) Ac in doublets exposed to 50 nM LPA as a function of time in culture before and after adding 10 μM Bb to the culture medium. The gray area denotes SD (N = 3; n = 16). If not stated otherwise, N corresponds to the number of experiments, and n corresponds to the number of cell doublets. |
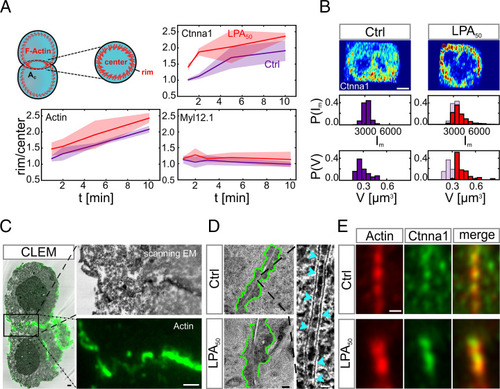
Cortical tension triggers Ctnna1/F-actin clustering at the contact of cell doublets. (A) Rim to center intensity ratios of core components of the cadherin adhesion complex in doublets. The schematic in Left shows the rim and center regions of the cell–cell contact where the fluorescence mean intensities were measured in control doublets (red line) and doublets exposed to LPA 50 nM (blue line). Doublets were fixed and analyzed for each time point separately (1-, 2-, 5-, and 10-min contact time). F-actin was visualized by Phalloidin with n = 3; (Ctrl) n = 5, 3, 3, and 3 (corresponding to the different contact times mentioned above); and (LPA) n = 6, 5, 4, and 5. Ctnna1 was visualized by immunohistochemistry with n = 3; (Ctrl) n = 5, 3, 5, and 5; and (LPA) n = 4, 3, 4, and 3. Myosin II was visualized by Myl12.1-eGFP expression with n = 1; (Ctrl) n = 9, 8, 7, and 8; and (LPA) n = 5, 5, 4, and 2. Shadowed areas denote SD. (B) Exemplary subdiffraction limited confocal images of Ctnna1 subcellular distribution at the cell–cell contact of control doublets (Left) and doublets exposed to 50 nM LPA (Right). Quantifications below show cluster mean intensity (Im) and volumes (V) of the 50 largest clusters of each cell–cell contact. Blue shadows in Right denote control conditions. (Ctrl) N = 1 and n = 3; (LPA) N = 1 and n = 5. (Scale bar: 5 μm.) (C) CLEM images with F-actin visualized by phalloidin–Alexa-488 (green). Right shows zoomed-in images of the boxed region in Left. (Scale bars: 1 μm.) (D, Left) Electron microscopy (EM) images of electron-dense clusters (outlined with green) at cell–cell contacts in control doublets (Upper) and doublets exposed to 50 nM LPA (Lower). (Scale bar: 200 nm.) D, Right is a zoomed-in image of cadherin-like clusters with individual clusters depicted by light blue arrowheads. (Scale bar: 20 nm.) (E) Representative Airy Scan images of F-actin (red) and Ctnna1 (green) colocalizing in clusters at the cell–cell contact of control doublets (Upper) and doublets exposed to 50 nM LPA (Lower). Cell doublets were fixed after 30-min contact time and visualized by Phalloidin (F-actin) and immunohistochemistry (Ctnna1). If not stated otherwise, N corresponds to the number of experiments, and n corresponds to the number of cell doublets. (Scale bar: 2 μm.) |
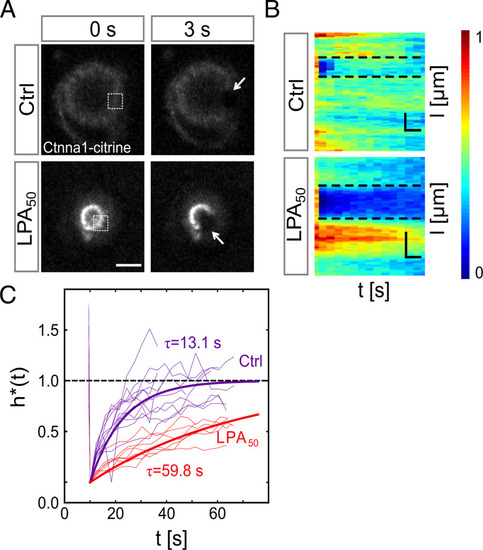
Cortical tension reduces Ctnna1 turnover at the contact of cell doublets. (A) FRAP analysis of Ctnna1 turnover at the contact of progenitor cell doublets. Fluorescence images of Ctnna1 localization within the contact plane of control doublets (Upper) and doublets exposed to 50 nM LPA (Lower) in the last prebleach (Left) and first postbleach frames (Right). Boxed regions (Left) and arrows (Right) outline bleached regions. (Scale bar: 10 μm.) (B) Normalized intensity kymographs of Ctnna1 recovery after photobleaching at the cell–cell contact edge of control doublets and doublets exposed to 50 nM LPA. (Scale bars: horizontal, 6 s; vertical, 10 μm.) (C) Quantification of Ctnna1 fluorescence intensity within the bleached regions at the contact edge of control doublets (purple) and doublets exposed to 50 nM LPA (red) as a function of time after photobleaching. τ denotes the recovery characteristic timescale. Thin lines denote individual cases, and thick lines are averages. (Ctrl) N = 3 and n = 12; (LPA50) N = 2 and n = 7. Materials and Methods has details. If not stated otherwise, N corresponds to the number of experiments, and n corresponds to the number of cell doublets. |
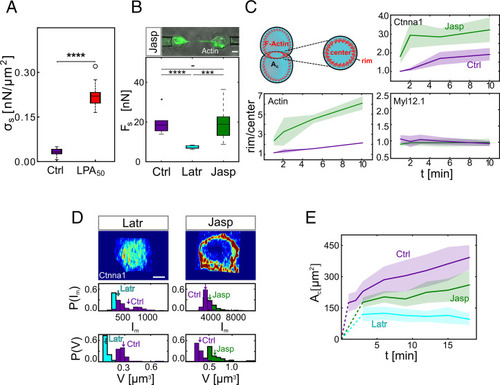
Enhanced cytoskeletal anchoring of the cadherin adhesion complex by cortical tension limits contact expansion in doublets. (A) Contact stress (σc) for control progenitor cell doublets and doublets exposed to 50 nM LPA after 10-min contact time. (Ctrl) N = 13 and total n = 17; (LPA50) N = 7 and total n = 12. ****P value = 3.6e-17 Student’s t test. (B) Separation force (Fs) for control doublets and doublets exposed to 300 nM Latr or 100 nM Jasp. Upper shows actin-rich tethers formed between the cells during separation in the presence of Jasp. (Ctrl) N = 3 and n = 10; (Latr) N = 1 and n = 8; (Jasp) N = 3 and n = 13. (Ctrl–Jasp) Not significant (t test with Bonferroni correction for multiple comparisons). ***(Latr–Jasp) P value = 6.96e-4; ****(Ctrl–Latr) P value = 1.92e-5. (Scale bar: 5 μm.) (C) Rim to center mean intensity ratios for F-actin, myosin II, and Ctnna1 as a function of contact time (1, 2, 5, and 10 min) in the presence or absence of Jasp. F-actin was visualized by Phalloidin with N = 3; (Ctrl) n = 5, 3, 3, and 3 (corresponding to the different contact times mentioned above); and (Jasp) n = 3, 4, 3, and 4. Ctnna1 was visualized by immunohistochemistry with N = 1; (Ctrl) n = 5, 3, 5, and 5; and (Jasp) n = 3, 3, 3, and 4. Myosin II was visualized by Myl12.1-eGFP expression with N = 1; (Ctrl) n = 9, 8, 7, and 8; and (Jasp) n = 12, 9, 11, and 8. The shadowed areas denote SD. (D) Exemplary Airy Scan images of Ctnna1 subcellular localization at the contact edge of doublets exposed to Latr or Jasp. Quantifications below show cluster mean intensity (Im) and volumes (V) of the 50 largest clusters of each cell–cell contact. Arrows indicate distribution means. N = 1; (Latr) n = 7; and (Jasp) n = 5. (Scale bar: 5 μm.) (E) Cell–cell contact size (Ac) of control doublets and doublets exposed to Jasp or Latr as a function of contact time. Dotted lines connect contact formation (0 min) with the first time point when data were collected. The shadowed area denotes SD with (Ctrl) N and n as in Fig. 1C. (Jasp) N = 4, n = (3 min: 6, 6 min: 6, 9 min: 16, 12 min: 16, 15 min: 16, 18 min: 16); (Latr) N = 4, n = (3 min: 21, 6 min: 21, 9 min: 21, 12 min: 21, 15 min: 21, 18 min: 9). If not stated otherwise, N corresponds to the number of experiments, and n corresponds to the number of cell doublets. |

Defective cytoskeletal anchoring of the cadherin adhesion complex suppresses the effect of cortical tension on contact expansion. (A) Subcellular localization of Cdh2FL-eGFP, Cdh2Δcyto-eGFP, and Cdh2Δcyto‐UtrABD-eGFP at the contact of doublets in the presence or absence of 50 nM LPA. (Scale bar: 5 μm.) (B) Cell–cell contact size (Ac) in doublets expressing either Cdh2FL (pink), Cdh2Δcyto (blue), or Cdh2Δcyto‐UtrABD-eGFP (green and yellow) in the presence (dotted lines, yellow for Cdh2Δcyto‐UtrABD-eGFP) or absence (solid lines, green for Cdh2Δcyto‐UtrABD-eGFP) of 50 nM LPA. Dashed lines connect contact formation (0 min) with the first time point when data were collected. SDs are shown in SI Appendix, Fig. S8. (Cdh2FL) N = 2, n = (3 min: 8, 6 min: 8, 9 min: 8, 12 min: 8); (Cdh2Δcyto) N = 2, n = (3 min: 14, 6 min: 14, 9 min: 14, 12 min: 14); (Cdh2Δcyto + LPA50) N = 2, n = (3 min: 9, 6 min: 9, 9 min: 9, 12 min: 9); (Cdh2FL + LPA50) N = 2, n = (3 min: 10, 6 min: 10, 9 min: 10, 12 min: 10); (Cdh2Δcyto-UtrABD-eGFP) N = 3, n = (3 min: 5, 6 min: 5, 9 min: 5, 12 min: 5); (Cdh2Δcyto-UtrABD-eGFP + LPA50) N = 1, n = (3 min: 3, 6 min: 3, 9 min: 3, 12 min: 3). If not stated otherwise, N corresponds to the number of experiments, and n corresponds to the number of cell doublets. |