FIGURE SUMMARY
Title

Epigenetic dynamics shaping melanophore and iridophore cell fate in zebrafish

Authors
Jang, H.S., Chen, Y., Ge, J., Wilkening, A.N., Hou, Y., Lee, H.J., Choi, Y.R., Lowdon, R.F., Xing, X., Li, D., Kaufman, C.K., Johnson, S.L., Wang, T.
Source
Full text @ Genome Biol.

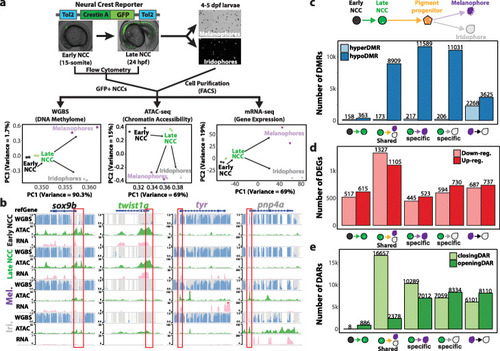
Epigenetic and transcriptomic dynamics of neural crest cell differentiation into pigment cells. a Schematic of sample collection method and principle component analysis on the DNA methylome, chromatin accessibility, and transcriptome of each cell type. b WashU Epigenome browser views of zebrafish early neural crest marker gene (sox9b), neural crest marker gene (twist1a), melanophore marker gene (tyr), and iridophore marker gene (pnp4a). Grey bars represent CpG sites while height of the blue bars indicates methylation levels. The red box demarcates promoter regions of marker genes. c–e Bar charts illustrating the number of DMRs (c), DEGs (d), and DARs (e) when comparing early NCCs, late NCCs, melanophores, and iridophores. DMRs were identified using DSS (p value < 0.001)

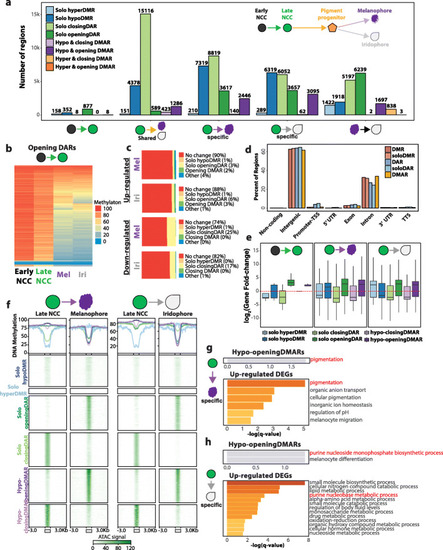
Characterization and annotation of DMARs. a Bar plot illustrating the number of DMARs identified across pigment cell differentiation. No HyperDMARs were detected, except in melanophore vs. iridophore comparison. b Heatmap illustrating the DNA methylation levels of opening DARs identified in early NCC to late NCC transition. c Epigenetic dynamics of DEG promoters in melanophores and iridophores. d Genomic feature distribution of DMRs, DARs, and DMARs. e Expression fold-change of closest DEGs within 50 kb of epigenetically dynamic regions. f Line graphs and heatmaps representing average DNA methylation levels and ATAC peak signals respectively of epigenetically dynamic regions from late NCC to pigment cell-type comparison. g, h Gene ontology enrichment of DEGs within 50 kb of hypo-opening DMARs and upregulated DEGs in melanophore-specific (g) and iridophore-specific (h) comparison

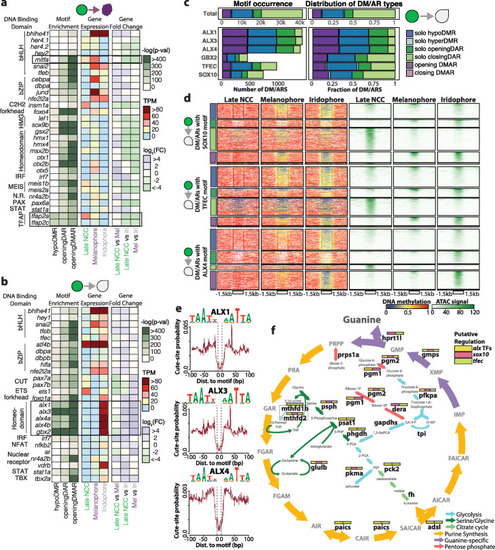
Motif enrichment analysis reveals alx transcription factor family as putative regulator of iridophore development. a, b Heatmaps representing motif enrichment, gene expression, and gene fold change of transcription factors when comparing late NCC differentiation into melanophores (a) and iridophores (b). c Bar plots representing frequency and distribution of iridophore-associated DM/ARs with a particular TF motif. d Heatmaps representing DNA methylation and ATAC signal across iridophore-associated DM/ARs with specific TF motifs. e ATAC-seq footprint signatures of alx transcription factor candidates. f Model of guanine synthesis cycle. Iridophore-specific DEGs are shown in bold. Boxes above DEGs are color-coded based on detection of CREs containing TF motifs within 50 kb of DEG promoters

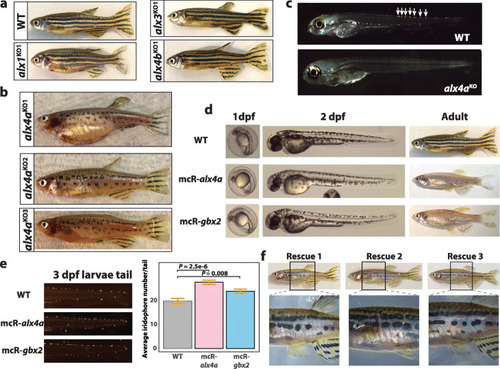
Functional validation of alx4a and gbx2 in iridophore development. a Lateral view of WT and alx1KO, alx3 KO, alx4b KO fish. b Lateral view of alx4a CRISPR-mediated knockout fish. c Iridophore detection in 4 dpf larvae of WT and alx4a knockout larvae. White arrows mark iridophores in WT larvae. d Lateral views of 1 dpf larvae, 2 dpf larvae, and adult fish comparing WT to Tg(miniCoopR-alx4a) and Tg(miniCoopR-gbx2) fish. e Representative pictures and quantification of iridophores from 3 dpf larvae tail trunks of WT (n = 21), Tg(miniCoopR-alx4a) (n = 20), and Tg(miniCoopR-gbx2) (n = 20). P values were calculated with two-tailed Welch’s t-test. Error bars represent ± SE. f Lateral whole-body view of iridophore rescue in three mosaic tg(miniCoopR-alx4a;alx4aKO) fish. Black box denotes the zoomed region in picture below

Acknowledgments
This image is the copyrighted work of the attributed author or publisher, and ZFIN has permission only to display this image to its users. Additional permissions should be obtained from the applicable author or publisher of the image. Full text @ Genome Biol.