FIGURE SUMMARY
Title

Sumoylation regulates the assembly and activity of the SMN complex

Authors
Riboldi, G.M., Faravelli, I., Kuwajima, T., Delestrée, N., Dermentzaki, G., De Planell-Saguer, M., Rinchetti, P., Hao, L.T., Beattie, C.C., Corti, S., Przedborski, S., Mentis, G.Z., Lotti, F.
Source
Full text @ Nat. Commun.

Sumoylation is required for the localization and integrity of the SMN complex.

a SDS-PAGE and Western blot analysis of endogenous UBC9 protein levels in HeLa wildtype (WT) or UBC9RNAi cells cultured without (-) or with (+) Doxycycline (Dox) for 4 days. A twofold serial dilution of WT HeLa cell extract is analyzed on the left. b Western blot analysis of anti-SUMO-2/3 immunoprecipitates in HeLa WT or UBC9RNAi cells cultured without (−) or with (+) Dox for 4 days. c Representative fluorescent images of HeLa UBC9RNAi cells cultured without (−) or with (+) Dox for 4 days and stained with antibodies against SMN, GEMIN2, GEMIN3, GEMIN5, and GEMIN6 (green), and with DAPI (blue). Cytoplasmic foci are indicated with white arrowheads. Scale bar, 10 μm (figures are representative of n = 3 biologically independent experiments). d Quantification of number of cells with cytoplasmic foci from the same groups as in (c). Data represent means and SEM (n = 3 biologically independent experiments). Statistical significance was determined by two-sided, unpaired multiple t tests followed by Holm-Sidak correction (adjusted P values −Dox vs. +Dox: SMN = 0.023007; GEMIN2 = 0.026589; GEMIN3 = 0.010270; GEMIN5 = 0.023007; GEMIN6 = 0.023007). e Cell extracts from HeLa UBC9RNAi cells cultured without (−) or with (+) Dox for 4 days were fractionated by 10–30% sucrose gradient centrifugation. Endogenous SMN levels in each fraction were analyzed by SDS-PAGE and Western blot. Numbers of fractions and sedimentation (S) values are indicated.

Components of the SMN complex are modified by SUMO.

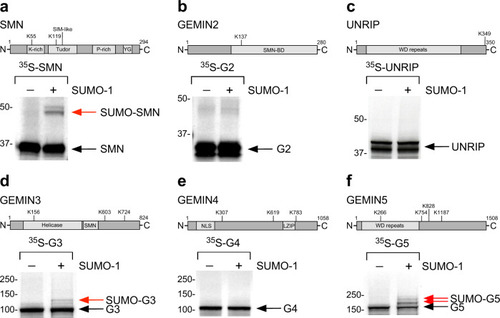
Schematic representation of the bioinformatically predicted sumoylation sites in SMN (a), GEMIN2 (b), UNRIP (c), GEMIN3 (d), GEMIN4 (e), GEMIN5 (f) and in vitro sumoylation of the respective 35S-labeled recombinant proteins. Red arrows indicate the position of the SUMO-modified proteins.

The SIM domain of SMN is required for its interaction with SUMO-modifiable components of the SMN complex.

a Schematic representation of the different SMN protein domains and amino acid residues in the portion of the Tudor domain that contains the SUMO-interacting motif (SIM). The residue positions of the SIM are indicated in blue. K119 is the putative sumoylation site based on SUMOplot analysis. E134 is the position of a mutation found in SMA patients (E134K). The changes in SMN protein sequence to generate SMN-2VA and SMN-E134K mutants are reported in red. b The SIM-like motif of SMN is required to directly bind with SUMO in vitro. Equal protein amounts of purified His-SUMO1 or SUMO-2 (Input) were individually incubated with wildtype (WT) SMN Tudor domain (WT-TD) or its SIM mutants (TD-2VA) of GST-fusion proteins purified from E. Coli expression system and pulled down with Glutathione-sepharose beads. Bound complexes were analyzed by immunoblotting (IB) with the indicated antibodies. The amounts of recombinant proteins were evaluated by Coomassie staining of 10% of the input. c HEK-293T cells were transfected with FLAG-tag SMN wildtype (WT), SIM-less (2 VA), or SMA (E134K) mutants. Cell lysates were prepared for precipitation with anti-FLAG agarose beads. 5% of the input and the immunoprecipitates (FLAG-IP) were analyzed by SDS-PAGE and Western blot with antibodies against the proteins indicated on the right. Naive HEK-293T cells were used as control. * indicate IgG heavy chain. d HEK-293T cells were transfected with FLAG-tag GEMIN5 wildtype (G5-WT) or its non-sumoylatable mutant (G5-2KR). Cell lysates were prepared for precipitation with anti-FLAG agarose beads. Five percent of the input and the immunoprecipitates (FLAG-IP) were analyzed by SDS-PAGE and Western blot with antibodies against the proteins indicated on the right. Naïve HEK-293T cells were used as control. e Representative fluorescent images of HeLa cells transfected with wildtype (WT) or non-sumoylatable (2KR) GEMIN5 and stained with antibodies against SMN (green) and FLAG (GEMIN5 in red), and with DAPI (blue). Scale bar, 20 μm.

Loss of SMN SIM domain alters the localization and stability of the SMN complex and its function in the assembly of small nuclear ribonucleoproteins.

a Cell extracts from NIH3T3-SmnRNAi cells expressing SMN-WT or SMN-2VA and treated with doxycycline (Dox) for 7 days were fractionated by 10-30% sucrose gradient centrifugation. SMN in each fraction was detected by SDS-PAGE and Western analysis. Number of fractions and sedimentation (S) values are indicated. b Representative images of NIH3T3-SmnRNAi cells expressing SMN-WT or SMN-2VA and cultured with Dox for 7 days and stained with anti-flag antibody. Scale bar, 10 μm. c Quantification of the number of cells with nuclear Gems in NIH3T3-SmnRNAi cells expressing SMN-WT or SMN-2VA and cultured with Dox for 7 days. Data represent means and SEM of three independent experiments (n = 3). Statistical significance was determined by two-tailed unpaired t test (P value = 0.0007). d Representative western blot analysis of SMN levels in NIH3T3-SmnRNAi cells expressing SMN-WT or SMN-2VA and treated with Dox for 7 days and cycloheximide at different time points. Tubulin is used as loading control. e Quantification of the SMN levels from three independent Western blots experiments as in (d) (n = 3 independent biological experiments). Data represent mean and SEM. f Equal amounts of cell extracts from NIH3T3-SmnRNAi cells expressing SMN-WT or SMN-2VA and treated without (−) or with (+) Dox for 7 days were analyzed in snRNP assembly reactions by immunoprecipitation of radioactive U1 snRNA with anti-SmB (18F6) antibody followed by electrophoresis on denaturing polyacrylamide gels and autoradiography. g The amount of U1 snRNA immunoprecipitated in snRNP assembly experiments as in (f) was quantified using a Typhoon Phosphorimager and expressed as a percentage of that in samples without Dox treatment. Data represent means and SEM of three independent biological experiments (n = 3). Statistical significance was determined by two-sided, unpaired multiple t tests followed by Holm-Sidak correction (adjusted P values −Dox vs. +Dox: RNAi = 0.000011; WT = 0.020757; 2 VA0.000319).

SIM-less SMN fails to rescue motor axon deficits in a zebrafish model of SMA.

a 250 pg of WT or 2 VA human SMN RNA was injected into one-cell stage mz-smn mutants zebrafish embryos and western blot analysis showed that both WT and mutant SMN protein are expressed at comparable levels. b Representative images of motor neuron phenotype for each group. Scale bar 50 μm. Truncated motor axons (white arrows) and branched motor axons (red arrowheads) occur, in relation to SMN levels reduction, with increasing degrees of severity determining the classification in one phenotypic class. c Animals were scored as having severe, moderate, mild or no defects in their motor axons at 28 h post fertilization (hpf). Data represent means and SEM. Three independent experiments were performed with 14–21 animals per experiment. Statistics were performed with two tailed Mann–Whitney non-parametric rank test (wt vs mz-smnp p < 0.0001; wt vs mz-smn + WT RNA p = 0.865; wt vs mz-smn + 2 VA SMN RNA p < 0.0001; mz-smn vs mz-smn + WT SMN RNA p < 0.0001; mz-smn vs mz-smn + 2 VA SMN RNA p = 0.624; mz-smn + WT SMN RNA vs mz-smn + 2 VA SMN RNA p < 0.0001).

SIM-less SMN gene delivery marginally improves survival and motor function of SMA mice.

a RT-qPCR analysis of full-length human SMN mRNA in the spinal cord of SMA mice injected with AAV9-GFP, AAV9-SMN-WT or AAV9-SMN-2VA. Data represent mean and SEM (n = 5 animals). Statistical significance was determined by one-way ANOVA with Tukey’s post hoc test (adjusted P values: SMA + GFP vs. SMA + SMN-WT p < 0.0001; SMA + GFP vs. SMA + SMN-2VA p = 0.0001; SMA + SMN-WT vs. SMA + SMN-2VA p = 0.9742. b Western blot analysis of GFP and SMN WT or 2 VA protein levels in the spinal cord of AAV9-injected SMA mice and uninjected WT controls at P9. Tubulin is used as loading controls. c Quantification of four independent Western blot experiments. Data represent mean and SEM (n = 4). Statistical significance was determined by one-way ANOVA with Tukey’s post hoc test (adjusted P values: WT vs. SMA p < 0.0001; WT vs. SMA + GFP p < 0.0001; WT vs. SMA + SMN-WT p = 0.0032; WT vs. SMA + SMN-2VA p = 0.0063; SMA vs. SMA + GFP p = 0.9723; SMA vs. SMA + SMN-WT p < 0.0001; SMA vs. SMA + SMN-2VA p < 0.0001; SMA + GFP vs. SMA + SMN-WT p < 0.0001; SMA + GFP vs. SMA + SMN-2VA p < 0.0001; SMA + SMN-WT vs. SMA + SMN-2VA p = 0.9962). df Kaplan–Meyer analysis of survival (d; WT n = 15; SMA + GFP n = 16; SMA + SMN-WT n = 15, SMA + SMN-2VA n = 15), righting time (e; WT n = 15; SMA + GFP n = 13; SMA + SMN-WT n = 17, SMA + SMN-2VA n = 18), and weight gain (f; WT n = 15; SMA + GFP n = 18; SMA + SMN-WT n = 17, SMA + SMN-2VA n = 17). Data represent mean and SEM.

SIM-less SMN partially rescues motor neuron loss and NMJ denervation in SMA mice.

a ChAT immunostaining of L1 spinal cords from WT mice or SMA mice injected with AAV9-GFP, AAV9-SMN-WT, or AAV9-SMN-2VA at P9. Scale bar = 20 µm. b NMJ staining with bungarotoxin (BTX, red), synaptophysin (SYP, green), and neurofilament (NF-M, blue) of quadratus lumborum (QL) muscles from the same groups as in (a) at P9. SMN deficiency determines alterations at the NMJ level, affecting their proper innervation (denervated endplates appear as isolated red structures –white arrowheads– without colocalization between bungarotoxin and synaptophysin). Scale bar = 10 µm. c Total number of L1 motor neurons in the same groups as in (a) at P9. Data represent mean and SEM (WT n = 7 animals; SMA + GFP n = 7 animals; SMA + SMN-WT n = 8 animals; SMA + SMN-2VA n = 7 animals). Statistical significance was determined by one-way ANOVA with Tukey’s post hoc test (adjusted P values: WT vs. SMA + GFP p < 0.0001; WT vs. SMA + SMN-WT p < 0.0001; WT vs. SMA + SMN-2VA p < 0.0001; SMA + GFP vs. SMA + SMN-WT p < 0.0001; SMA + GFP vs. SMA + SMN-2VA p = 0.0012; SMA + SMN-WT vs. SMA + SMN-2VA p = 0.2171). d Percentage of fully innervated neuromuscular junctions (NMJs) in the QL muscle from the same groups as in (b) at P9. Data represent mean and SEM (WT n = 9 animals; SMA + GFP n = 7 animals; SMA + SMN-WT n = 8 animals; SMA + SMN-2VA n = 7 animals). Statistical significance was determined by one-way ANOVA with Tukey’s post hoc test (adjusted P values: WT vs. SMA + GFP p < 0.0001; WT vs. SMA + SMN-WT p = 0.0878; WT vs. SMA + SMN-2VA p < 0.0001; SMA + GFP vs. SMA + SMN-WT p < 0.0001; SMA + GFP vs. SMA + SMN-2VA p = 0.0018; SMA + SMN-WT vs. SMA + SMN-2VA p < 0.0001). Significant differences with WT have been reported immediately atop of each bar plot, while comparisons between the other experimental conditions have been graphed with connecting lines.

SIM-less SMN fails to rescue sensory-motor circuit dysfunctions in SMA mice.

a Immunostaining of VGluT1 + synapses (white dots) and ChAT + MNs (blue) in L1 spinal cord sections from WT mice or SMA mice injected with AAV9-GFP, AAV9-SMN-WT or AAV9-SMN-2VA at P9. Scale bar = 20 µm; scale bar of the insert = 10 µm. b Representative traces of extracellular recordings from L1 ventral root following L1 dorsal root stimulation from WT mice or SMA mice injected with AAV9-GFP, AAV9-SMN-WT or AAV9-SMN-2VA at P9. Arrows indicate the maximum amplitude of the monosynaptic reflex. Arrowheads indicate the stimulus artifact. Scale bars = 0.5 mV and 10 ms. c Number of VGluT1 + synaptic boutons (white dots) on the somata of L1 MNs (blue) from the same groups as in (a) at P9. Data represent mean and SEM from WT, SMA + AAV9-GFP, SMA + AAV9-SMN-WT, and SMA + AAV9-SMN-2VA (average of boutons counted for at least 15 cells from 4 animals for each group, n = 4 animals). Statistical significance was determined by one-way ANOVA with Tukey’s post hoc test (adjusted P values: WT vs. SMA + GFP p < 0.0001; WT vs. SMA + SMN-WT p = 0.0085; WT vs. SMA + SMN-2VA p < 0.0001; SMA + GFP vs. SMA + SMN-WT p = 0.003; SMA + GFP vs. SMA + SMN-2VA p = 0.8208; SMA + SMN-WT vs. SMA + SMN-2VA p = 0.0132). d Quantification of spinal reflex amplitudes recorded from the same groups as in (b) at P9. Data represent mean and SEM (n = 4 animals). Statistical significance was determined by one-way ANOVA with Tukey’s post hoc test (adjusted P values: WT vs. SMA + GFP p = 0.0002; WT vs. SMA + SMN-WT p = 0.0633; WT vs. SMA + SMN-2VA p = 0.0002; SMA + GFP vs. SMA + SMN-WT p = 0.0254; SMA + GFP vs. SMA + SMN-2VA p = 0.9922; SMA + SMN-WT vs. SMA + SMN-2VA p = 0.0157). Significant differences with WT have been reported immediately atop of each bar plot, while comparisons between the other experimental conditions have been graphed with connecting lines.

SIM-less SMN fails to rescue select downstream RNA processing events disrupted by SMN deficiency in SMA mice.

a RT-qPCR analysis of aberrantly spliced Stasimon (Stas) mRNA (indicated by the red lines between exon 3 and exon 5) in the spinal cord from WT mice or SMA mice injected with AAV9-GFP, AAV9-SMN-WT, or AAV9-SMN-2VA at P9. Data represent mean and SEM (WT n = 5 animals; SMA + GFP n = 5 animals; SMA + SMN-WT n = 5 animals; SMA + SMN-2VA n = 4 animals). Statistical significance was determined by one-way ANOVA with Tukey’s post hoc test (adjusted P values: WT vs. SMA + GFP p = 0.0001; WT vs. SMA + SMN-WT p = 0.9561; WT vs. SMA + SMN-2VA p = 0.0162; SMA + GFP vs. SMA + SMN-WT p = 0.0003; SMA + GFP vs. SMA + SMN-2VA p = 0.1682; SMA + SMN-WT vs. SMA + SMN-2VA p = 0.0408). b RT-qPCR analysis of total 3′ end-extended histone H1c mRNA. Data represent mean and SEM (WT n = 5 animals; SMA + GFP n = 5 animals; SMA + SMN-WT n = 5 animals; SMA + SMN-2VA n = 4 animals). Statistical significance was determined by one-way ANOVA with Tukey’s post hoc test (adjusted P values: WT vs. SMA + GFP p < 0.0001; WT vs. SMA + SMN-WT p = 0.0827; WT vs. SMA + SMN-2VA p < 0.0001; SMA + GFP vs. SMA + SMN-WT p < 0.0001; SMA + GFP vs. SMA + SMN-2VA p = 0.0725; SMA + SMN-WT vs. SMA + SMN-2VA p = 0.0036). c Cdkn1a mRNA in the spinal cord at P9 from the same treatment groups as in (a). Data represent mean and SEM (WT n = 5 animals; SMA + GFP n = 5 animals; SMA + SMN-WT n = 5 animals; SMA + SMN-2VA n = 4 animals). Statistical significance was determined by one-way ANOVA with Tukey’s post hoc test (adjusted P values: WT vs. SMA + GFP p < 0.0001; WT vs. SMA + SMN-WT p = 0.6815; WT vs. SMA + SMN-2VA p = 0.0464; SMA + GFP vs. SMA + SMN-WT p = 0.0005; SMA + GFP vs. SMA + SMN-2VA p = 0.0319; SMA + SMN-WT vs. SMA + SMN-2VA p = 0.2841). Significant differences with WT have been reported immediately atop of each bar plot, while comparisons between the other experimental conditions have been graphed with connecting lines. d Model of the consequences of loss of SMN-SUMO interactions on the assembly and function of the SMN complex.

Acknowledgments
This image is the copyrighted work of the attributed author or publisher, and ZFIN has permission only to display this image to its users. Additional permissions should be obtained from the applicable author or publisher of the image. Full text @ Nat. Commun.