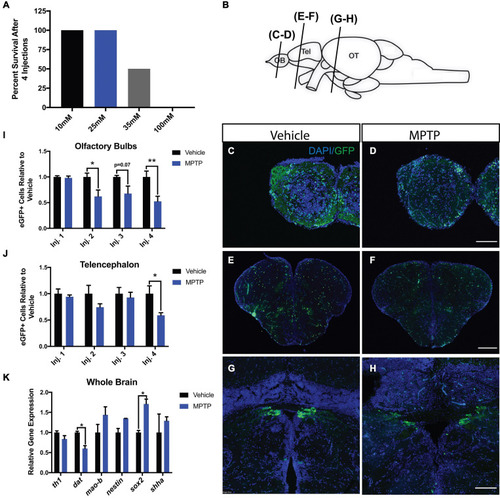
Impact of MPTP on various brain regions of adult Tg(dat:eGFP) zebrafish. (A) MPTP dose-response. (B) Schematic representation of the zebrafish brain with the planes of section indicated. Immunohistochemical labeling of eGFP (green) and DAPI (blue) to observe dopaminergic neurons in the olfactory bulbs (OBs) (C,D), telencephalon (E,F), and periventricular pretectal nucleus (PPv) (G,H). (I,J) Quantification of eGFP+ cells within the OBs and telencephalon respectively. (n = 6). (K) Whole brain qRT-PCR analysis for dopaminergic, and regeneration-related genes; th1, dat, sox2, nestin, and shha. (n = 3 whole brains from each respective group). Bars represent the mean ± the SEM. *p < 0.05, **p < 0.01. Scale bars = 100 and 200 μm for the OB/PPv and telencephalon respectively. OB, olfactory bulbs; Tel, telencephalon; OT, optic tectum.

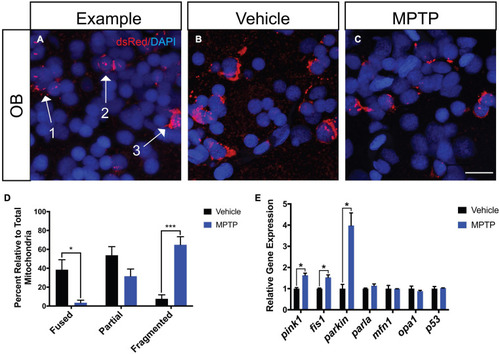
Effect of MPTP on mitochondrial fission-fusion dynamics in Tg(dat:tom20 MLS:mCherry) adult zebrafish. (A) Representative image depicting fragmented mitochondria (Arrow 1), partially fragmented mitochondria (Arrow 2), and fused mitochondria (Arrow 3). (B,C) Immunohistochemical labeling marked mCherry+ for mitochondrial visualization and nuclei with DAPI+ on coronal OB cryosections from vehicle and MPTP injected zebrafish. (D) Proportion of fused, partially fragmented and fragmented mitochondria (n = 4). (E) Whole brain qRT-PCR analysis for mitochondrial and apoptotic genes; mao-b, pink1, fis1, parkin, parla, mfn1, opa1, and p53 (n = 3 whole brains from each respective group). Scale bar = 10 μm. Bars represent the mean ± the SEM. *p < 0.05, ***p < 0.001.

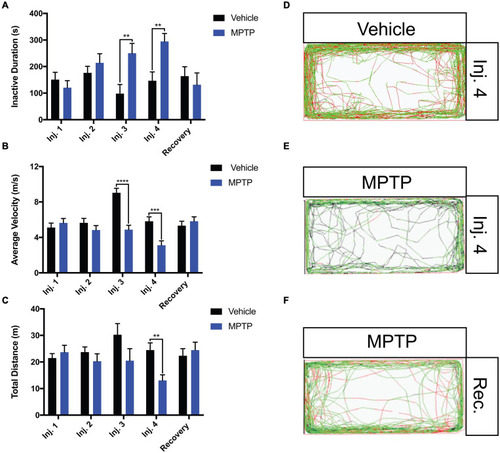
Impact of MPTP on adult zebrafish swimming behavior. Fish were acclimated to the apparatus for 15 min prior to behavioral analyses. Seven-minutes trials were performed. (A–C) Analysis of inactive durations (proxy for freezing bouts), average velocity and total distance for MPTP injected zebrafish and vehicle controls. Respective path images are as follows; injection 4 vehicle control (D), injection 4 MPTP (E), and 2-week recovered MPTP treated zebrafish (F). Red lines represent fast movement, green lines represent slow movement and black lines represent inactive movement below the slow threshold (n = 10 for all groups). Bars represent the mean ± the SEM. **p < 0.01, ***p < 0.001, and ****p < 0.0001.

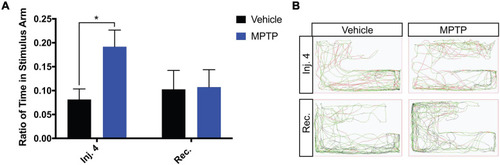
Impact of MPTP on olfactory response in adult zebrafish. (A) Ratio of time spent in the stimulus arm following the fourth injection and 2-week recovery. (B) Respective path images for MPTP injected zebrafish and vehicle controls after the fourth injection and a 2-week recovery. Red lines represent fast movement, green lines represent slow movement and black lines represent inactive movement below the slow threshold. Bars represent the mean ± the SEM. *p < 0.05.

Acknowledgments
This image is the copyrighted work of the attributed author or publisher, and ZFIN has permission only to display this image to its users. Additional permissions should be obtained from the applicable author or publisher of the image. Full text @ Front. Neurosci.