
- Title
-
Knock-in tagging in zebrafish facilitated by insertion into non-coding regions
- Authors
- Levic, D.S., Yamaguchi, N., Wang, S., Knaut, H., Bagnat, M.
- Source
- Full text @ Development
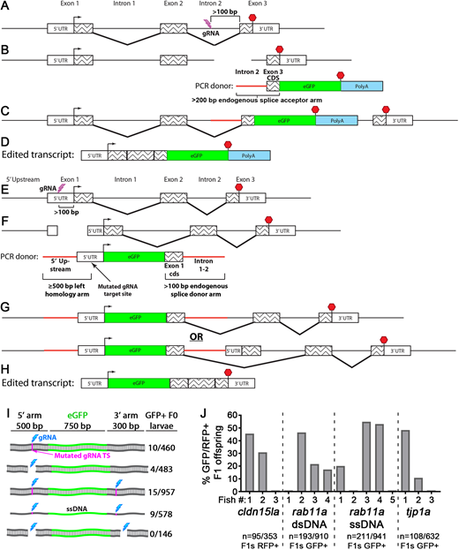
Knock-in tagging in zebrafish using splice donor and acceptor arms. (A-D) C-terminal endogenous tagging strategy. An intron 5′ to the last exon is targeted for a dsDNA break (A) and integration of a PCR repair donor containing a 5′ splice acceptor element (B). mRNA splicing mediates expression of the tagged protein (C,D). (E-H) N-terminal endogenous tagging strategy. A non-coding region 5′ to the start codon is targeted for a dsDNA break (E) and integration of a PCR repair donor containing a 5′ homology arm and 3′ splice donor element (F). mRNA splicing mediates expression of the tagged protein (G,H). (I) One-cell-stage embryos were injected with different rab11a knock-in (KI) cocktails and visually screened. Cyan bolt, gRNA target site; magenta line, mutated PAM site in repair donor; ssDNA, single-stranded DNA. Numbers to the right indicate the proportion of GFP+ surviving larvae. (J) One-cell-stage embryos were injected with KI cocktails for different genes and then visually screened. GFP/RFP+ F0 fish were outcrossed, and F1 progeny were visually screened. Data plotted indicate the levels of mosaicism present in the F0 generation. |
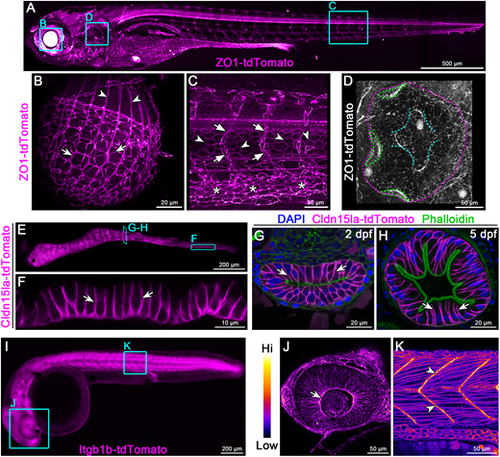
Endogenous C-terminal tagging of ZO-1, Cldn15la and Integrin β1b. (A-D) Live 3D reconstructions of TgKI(tjp1a-tdTomato)pd1224 heterozygous larvae. B: arrows, lens epithelial cells; arrowheads, lens fiber cells. C: arrows, intersegmental vessels; arrowheads, notochord sheath cells; asterisks, caudal vein plexus. D: magenta dotted line, otic capsule; green dotted lines, cristae; cyan dotted lines, canals and septum. Animals are 7 dpf (A), 5 dpf (B) and 3 dpf (C,D). (E,F) Live imaging of the intestine of a 7 dpf TgKI(cldn15la-tdTomato)pd1249 heterozygous larva. Arrows, intestinal epithelial cell (IEC) basolateral membrane. (G,H) Transverse sections of the intestine at stages of lumen opening (2 dpf) (G) and onset of larval feeding (5 dpf) (H). Arrows, IEC basolateral membrane. (I-K) Live imaging of a 28 hpf TgKI(itgb1b-tdTomato)sk108 heterozygous embryo. J and K are pseudo-colored according to the look-up table (LUT) scale shown. J: arrow, optic cup basolateral membrane. K: arrowheads, myotendinous junctions. Cyan boxes are representative regions of interest panels indicated. Scale bars: 500 µm (A); 20 µm (B,G,H); 50 µm (C,D,J,K); 200 µm (E,I); 10 µm (F). |
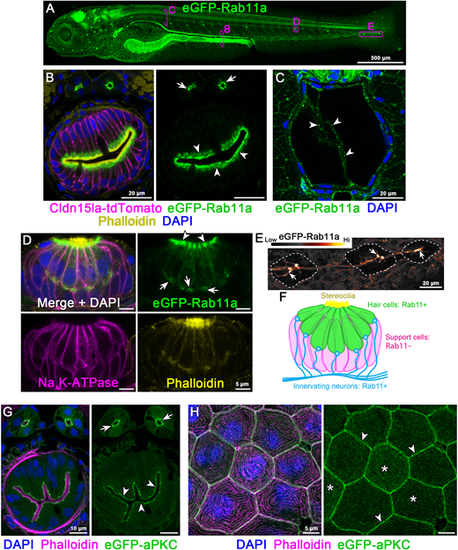
Endogenous N-terminal tagging of Rab11a and aPKC. (A) Live 3D reconstruction of 5 dpf TgKI(eGFP-rab11a)pd1244 heterozygous larva. Magenta boxes show representative regions of interest for panels B-E. (B) Transverse section through the posterior mid-intestine (LREs, arrowheads) and pronephric ducts (arrows). (C) Transverse section through the notochord. Arrowheads, notochord vacuolated cells. (D) Whole-mount image of a neuromast. Arrowheads, apical cytoplasm; arrows, basal cytoplasm. (E) Live image of neurons innervating lateral line neuromasts (dotted line). Image is pseudo-colored according to the LUT scale shown. Arrows, neuronal tracts. (F) Schematic of Rab11a expression within neuromasts. (G,H) Transverse sections of TgKI(eGFP-prkci)pd1260 heterozygous larvae. (G) Transverse section of the mid-intestine. Arrowheads, IEC apical cortex; arrows, pronephric duct apical cortex. (H) Localization of eGFP-aPKC in periderm cells. Arrowheads, cell cortex; asterisks, apical microridges. Scale bars: 500 µm (A); 20 µm (B,C,E); 5 µm (D,H); 10 µm (G). |
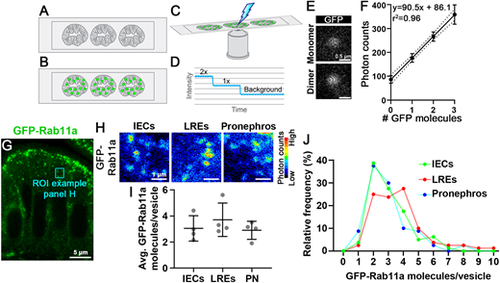
Tissue-specific Rab11a expression levels do not strongly affect its concentration on apical vesicles of the intestine or pronephros. (A-F) Single particle imaging of zebrafish tissue sections. Intestinal sections of GFP-negative larvae (A) are incubated with purified eGFP (B), and photon counts are collected and photobleached to background-level intensity (C). eGFP particle concentrations are inferred by the decay profile (D). (E,F) Single particle photon count imaging and linear regression analysis of purified eGFP photon emission from intestinal sections. (G) Transverse section of TgKI(eGFP-rab11a)pd1244 intestinal epithelial cells (IECs). Cyan box shows a representative region of interest of apical vesicles. (H) Pseudo-colored photon count images of apical vesicles of IECs, lysosome-rich enterocytes (LREs) and pronephric duct epithelial cells (PN). (I) Average eGFP-Rab11a concentration values from apical vesicles. Data points are mean values from tissue sections of individual larvae. Error bars show s.d. n=4 larvae for each organ (20 vesicles per animal). Data were not significantly different (one-way ANOVA). (J) Relative frequency plot of the data used for I. LREs versus IECs, P<0.05; LREs versus PN, P<0.01; IECs versus PN, not significant (one-way ANOVA). n=80 vesicles per organ. Scale bars: 0.5 µm (E); 5 µm (G); 1 µm (H). |