
- Title
-
Telomerase RNA recruits RNA polymerase II to target gene promoters to enhance myelopoiesis
- Authors
- García-Castillo, J., Alcaraz-Pérez, F., Martínez-Balsalobre, E., García-Moreno, D., Rossmann, M.P., Fernández-Lajarín, M., Bernabé-García, M., Pérez-Oliva, A.B., Rodríguez-Cortez, V.C., Bueno, C., Adatto, I., Agarwal, S., Menéndez, P., Zon, L.I., Mulero, V., Cayuela, M.L.
- Source
- Full text @ Proc. Natl. Acad. Sci. USA
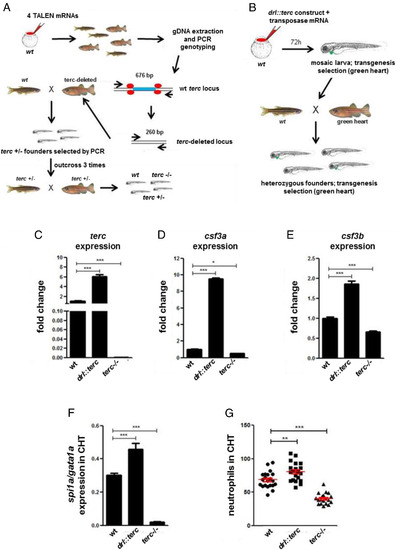
Zebrafish terc controls the expression of promyelopoietic genes in vivo. (A) Workflow of the generation of the terc−/− (terc KO) zebrafish line. (B) Workflow of the generation of the Tg(drl::terc) zebrafish line. (C–F) Expression of the indicated genes in the CHT of wild-type (wt), Tg(drl::terc), and terc KO fish larvae at 2 dpf. Data are representative results of three independent experiments; n = at least 20 larvae per group. (G) Neutrophil counts in the CHT of mpx::GFP larvae (neutrophils labeled by GFP) at 3 dpf. Data are the average of two independent experiments; n = 21 for wt and Tg(drl::terc), and n = 19 for terc KO. Data values shown are fold change over the value of wt sample in C, D, and E. All data are mean + SEM. *P < 0.05, **P < 0.01, and ***P < 0.001 for one-way ANOVA plus Bonferroni posttest. |
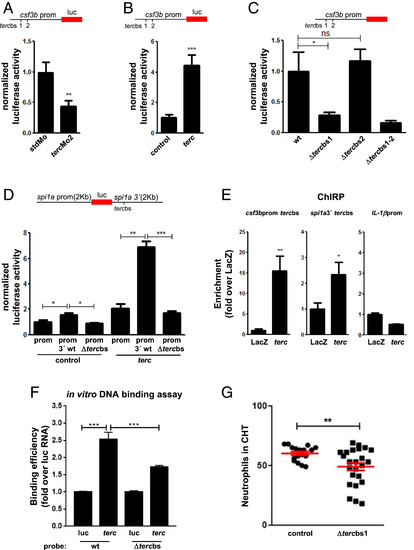
Telomerase RNA binds to target sequences in regulatory regions of zebrafish promyelopoietic genes and controls the activity of their promoters. (A and B) Activity of csf3a and csf3b promoters (∼2 kb upstream) in the CHT of larvae at 2 dpf after injection of the luciferase reporter constructs combined with tercMo2 or 200 pg/embryo of terc RNA. Data are representative results of three independent experiments. n = at least 30 larvae per group (see Materials and Methods); luc, luciferase. (C) Activity of tercbs-deleted csf3b promoter in the CHT of larvae at 2 dpf after injection of the luciferase reporter constructs. Data are representative results of three independent experiments. n = at least 30 larvae per group (see Materials and Methods). (D) Activity of the spi1a promoter (∼2 kb upstream) with wild-type (wt) or tercbs-deleted 3′ region (∼2 kb downstream) in CHT of larvae at 2 dpf after injection of the luciferase reporter constructs in combination with control or terc RNA. Data are representative results of three independent experiments. n = at least 30 larvae per group (see Materials and Methods). (E) qRT-PCR of ChIRP eluates of tercbs-containing DNA fragments encompassing the csf3b promoter and spi1a 3′ region. Data are representative results of two independent experiments; n = 20 WKM of adult fish. (F) qRT-PCR of in vitro DNA binding assay eluates. For each probe, data are the average of two independent experiments. luc, luciferase RNA. (G) Neutrophil counts in the CHT of mpx::GFP larvae at 3 dpf after injection of TALEN mRNAs to destroy the csf3b promoter tercbs1 in vivo (see Materials and Methods). Data are the average of two independent experiments; n = 17 and 24 larvae in control and tercbs-deleted groups, respectively. Data values shown are fold change over the value of the stdMo (standard morpholino) sample in A, the control sample in B, the csf3b wt promoter sample in C, the spi1a wt promoter + control sample in D, and the luc + wt probe sample in F. All data are mean + SEM. *P < 0.05, **P < 0.01, and ***P < 0.001 for Student’s t test in A, B, E, and G and for one-way ANOVA plus Bonferroni posttest in C, D, and F. ns, not significant. |
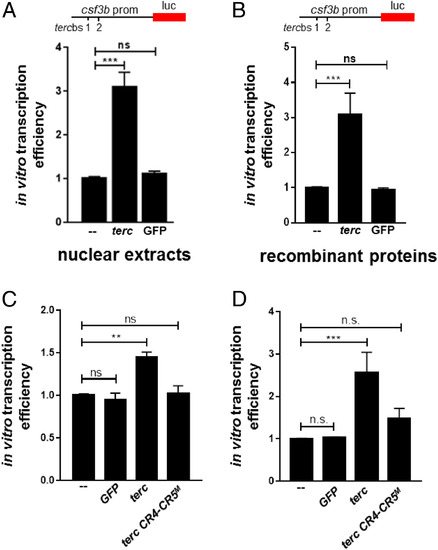
Telomerase RNA increases the efficiency of in vitro transcription. (A) In vitro transcription efficiency of csf3b promoter-driven luciferase reporter in the presence of 25 nM GFP, terc RNA, or no RNA as control, using nuclear extracts from HL60 cells as the source of the transcriptional machinery. Data are the average of at least three independent experiments. luc, luciferase. (B) Same as in A, using recombinant proteins as source of the transcriptional machinery. (C) In vitro transcription efficiency of csf3b promoter-driven luciferase reporter in the presence of 10 nM GFP, terc, CR4-CR5M mutant terc RNA, or no RNA as control, using nuclear extracts from HL60 cells as the source of the transcriptional machinery. Data are the average of at least three independent experiments. (D) Same as in C, using recombinant proteins as source of the transcriptional machinery. Data values shown for all panels are fold change over the no RNA control sample. All data are mean + SEM. **P < 0.01 and ***P < 0.001 for one-way ANOVA plus Bonferroni posttest in A, B, C, and D. ns, not significant. |
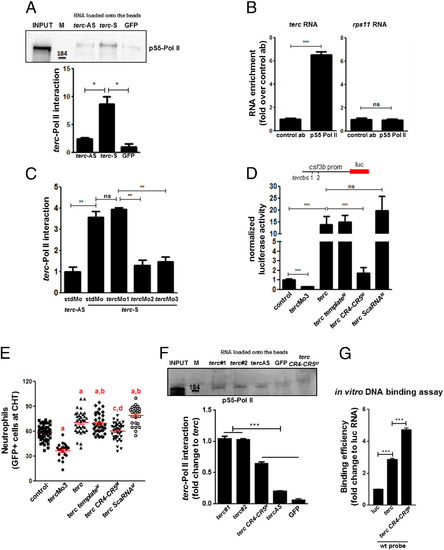
Telomerase RNA binds to RNA Pol II through its CR4-CR5 domain to promote developmental myelopoiesis in zebrafish. (A) Western blot of RNA pull-down eluates using anti-Phospho S5 RNA Pol II antibodies. For quantification of the interaction, Quantity One software was used; n = 2 independent experiments; M, molecular weight marker (kDa); n = at least 500 2-d larvae per group (see Materials and Methods). (B) qRT-PCR of RIP experiment using anti-Phospho S5 RNA Pol II assessing enrichment of terc RNA. Data are representative results of three independent experiments; n = at least 500 2-d larvae per group (see Materials and Methods). (C) Quantification of terc–RNA Pol II interaction in the presence of terc Mos (reference SI Appendix, Fig. S3C for representative Western blot); n = 2 independent experiments with at least 500 larvae at 2 dpf per group (see Materials and Methods). (D) Activity of the csf3b promoter in CHT of larvae at 2 dpf after injection of the luciferase reporter construct in combination with tercMo3 or terc RNA at 200 pg/embryo; n = at least 30 larvae per group; luc, luciferase; M, mutated (reference SI Appendix, Fig. S3A). (E) Neutrophil counts in the CHT of mpx::GFP larvae at 3 dpf after injection of tercMo3 or terc RNA; n = 50, 20, 35, 36, 36, and 24 larvae at 3 dpf in control, tercMo3, wt terc, terc templateM, terc CR4-CR5M, and terc ScaRNAM, respectively; M, mutated (reference SI Appendix, Fig. S3A). (F) Western blot of RNA pull-down eluates using anti-Phospho S5 RNA Pol II antibodies and quantification of the interaction. terc#1 and terc#2 are two independent pull-down samples; n = 2 independent experiments; M, molecular weight marker (kDa). (G) qRT-PCR of in vitro DNA binding assay eluates. luc, luciferase RNA. Data values shown are fold change over the value of GFP sample in A, the control antibody (ab) sample in B, the stdMo (standard morpholino) + terc − AS sample in C, the control sample in D, the terc#1 sample in F, and the luciferase sample in G. All data are mean + SEM. *P < 0.05, **P < 0.01, and ***P < 0.001 for Student’s t test in B and for one-way ANOVA plus Bonferroni posttest in A, C, D, E, F, and G; a is P < 0.05 versus control, b is not significant versus wt terc molecule, c is not significant versus control, and d is P < 0.05 versus wt terc molecule, one-way ANOVA plus Bonferroni posttest; ns, not significant. |
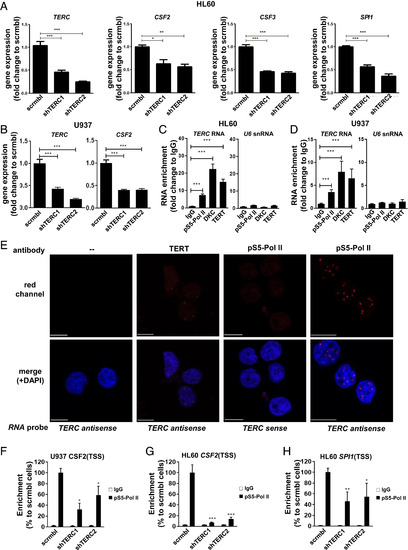
The regulation of myelopoiesis by the interaction of telomerase RNA with RNA Pol II is evolutionarily conserved. (A) qRT-PCR for indicated promyelopoietic genes in neutrophil-like HL60 cells transduced with two different shRNAs against TERC (shTERC1 and shTERC2) or a scrambled control shRNA (scrambled). Data are representative results of three independent experiments. (B) Same as in A, using promonocytic U937 cells. (C) qRT-PCR of RIP eluates in neutrophil-like HL60 cells assessing enrichment of indicated RNAs in the presence of anti-Phospho S5 RNA Pol II antibody, Dyskerin (DKC), TERT, or IgG controls. Data are representative results of three independent experiments. (D) Same as in C, using promonocytic U937 cells. (E) PLA cells showing TERC-pS5 Pol II interaction in the nucleus of HL60 cells. Note the foci of red fluorescence (indicating interaction) when pS5-Pol II and TERT antibodies were used. (F) qPCR for indicated locus after ChIP with anti-Phospho S5 RNA Pol II antibody or IgG control in promonocytic U937 cells transduced with two different shRNAs against TERC (shTERC1 and shTERC2) or a scrambled control shRNA (scrambled). Data are the average of at least two independent experiments. (G) Same as in F, using neutrophil-like HL60 cells. (H) Same as in G but for the indicated locus. Data values shown are fold change over the value of scrambled sample in A and B and the IgG sample in C and D. Data in F through H are % of enrichment over scrambled sample. All data are mean + SEM. *P < 0.05, **P < 0.01, and ***P < 0.001 for one-way ANOVA plus Bonferroni posttest in A through D and for Student’s t test in F and G. |
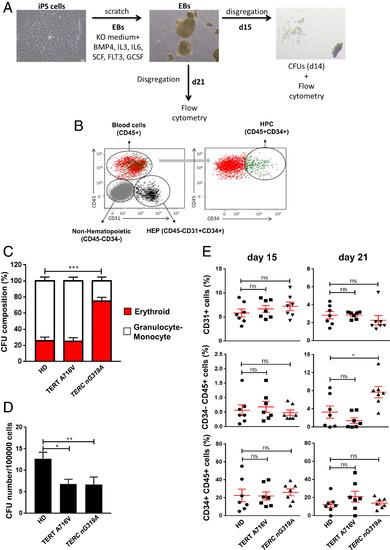
iPS cells carrying a mutation in the CR4-CR5 domain of TERC fail to properly differentiate into myeloids cells. (A) Workflow for differentiation of iPS cells. (B) Dot plot and identification of different cell populations in EBs by flow cytometry. CD31+ HEP (bipotential precursors of hematopoietic and endothelial cells), CD45+ CD34+ HPC, and CD45+ mature blood cells. (C) Composition of erythroid and granulocyte/monocyte colonies in CFU assays, using EBs derived from the indicated iPS cell lines. Data are the average of seven independent EB formation experiments. (D) Number of colonies per 100,000 EB cells. Data are the average of seven independent EB formation experiments. (E) Quantification of cell populations in EBs by flow cytometry. CD31+ (HEP), CD34+CD45+ (HPC), and CD45+ (mature blood cells) cells in day 15 and 21. Data are the average of seven independent EB formation experiments. All data are mean + SEM. *P < 0.05, **P < 0.01, and ***P < 0.001 for one-way ANOVA plus Dunnet’s posttest in all the panels. ns, not significant. |
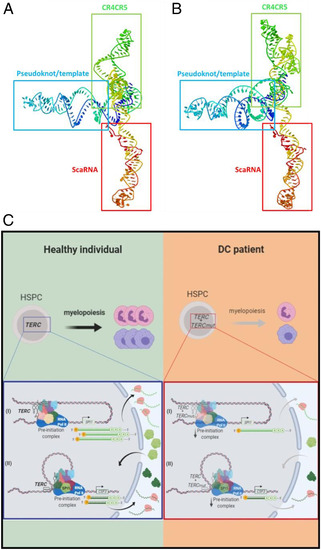
Predicting structure and proposed model of TERC function in myelopoiesis. (A and B) Prediction of TERC and TERC nG319A tertiary RNA structure. The processing of the structure was done with Jmol application of RNA Composer system (http://rnacomposer.cs.put.poznan.pl/), an open-source Java viewer for chemical structures in the third dimension (48). The different domains of the molecule are in different colors, starting 5′ in dark blue, followed by green, yellow, orange, and ending 3′ in red. (A) TERC wild-type structure. (B) TERC nG319A structure. (C) TERC regulation model of myeloid gene expression. Under normal conditions, TERC can regulate the expression of myelopoiesis genes (SPI1 and CSF3) in zebrafish and humans. Telomerase RNA binds DNA through its consensus binding sites and with RNA Pol II, facilitating its recruitment to myelopoietic gene promoters, ensuring robust myelopoiesis. DC patients with a mutation in the TERC CR4-CR5 domain, possibly due to a change in RNA structure, do not properly recruit RNA Pol II to promoters and fail to regulate the expression of myeloid genes, resulting in an alteration in myelopoiesis that causes a drop in myeloid cell production. This mechanism could serve as the basis for designing new strategies for therapeutic intervention. CR4-CR5 mutations will anticipate the development of myelodysplastic syndrome and signal the need for precision, personalized treatment. Pink cells are neutrophils and purple cells are macrophages; dark green proteins are G-CSF cytokine and light green protein are master transcriptional factor SPI1. |