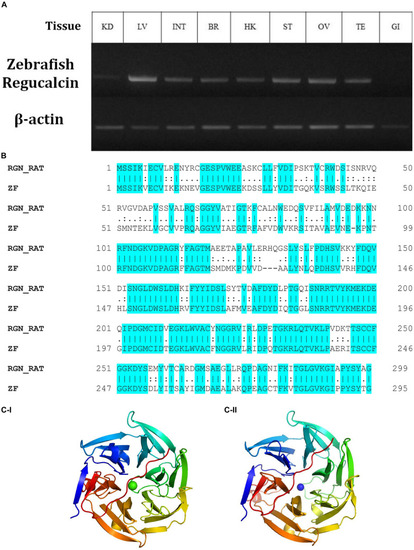
The relative expression of gulonolactonase (Danio rerio) in different tissues and its bioinformatics analysis. (A) Expression of zebrafish gulonolactonase (regucalcin) in KD (kidney), LV (liver), INT (intestine), BR (brain), HK (head-kidney), ST (stomach), OV (ovary), TE (testis), and GI (gill). Zebrafish β-actin (NM_181601.5) was used as the reference gene for RT-PCR analysis. (B) The pairwise sequence alignment between rat (RGN_RAT) (CAA48786.1) and zebrafish (ZF) (NM_205746) gulonolactonase proteins. This alignment indicates high sequence conservation between the rat and zebrafish gulonolactonase proteins. Homology structures for (C-I) Rat and (C-II) Zebrafish gulonolactonase. In both structures, the arrangement of the amino acids is similar, indicating conserved catalytic functions.
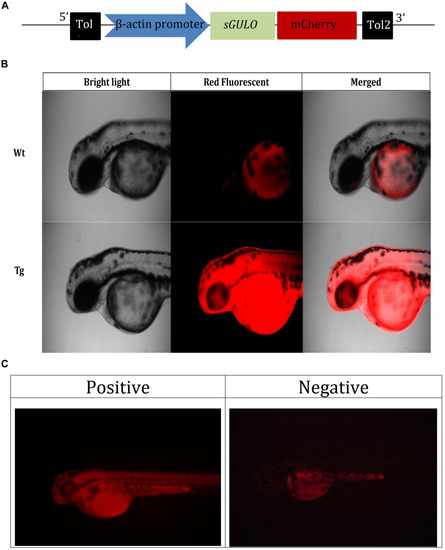
Selection of Tg fish expressing b-actin:sGULO:mCherry. (A) A schematic of the b-actin:sGULO:mCherry expression construct. The β-actin promoter sequence was used to drive the expression of sGULO fused with mCherry, which acts as a reporter for construct expression in Tg zebrafish. The poly-A segment includes a -G cap mRNA followed by Tol2 sequences, which act as transposable segment sequences needed to integrate the construct into the zebrafish genome. (B) The mCherry fluorescent signal in Tg and Wt fish. (C) Positive Tg embryos showed red fluorescence in their muscles, and negative fish lacked this fluorescent signal. The positive and negative F0 generation embryos were anesthetized using tricaine, mounted on a microscope slide using 2% methylcellulose, and observed under a fluorescent microscope (Leica, DM600B) under ×100 and ×200 magnifications.

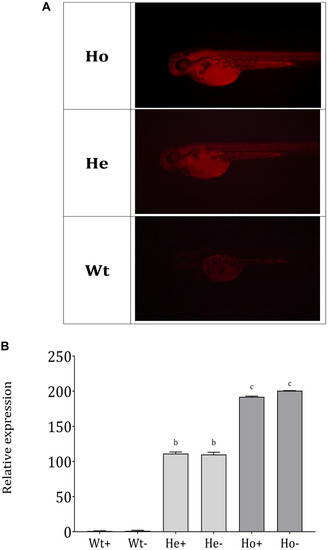
Separation of Ho and He Tg fish lineages and sGULO expression. (A)Tg F1 male and F1 female fish were crossed, and the offspring were categorized into three groups based on the fluorescence intensity levels. Wt fish showed no fluorescent signal in their head region and muscles. Ho and He fish had fluorescent signals in their head and muscle regions, which was higher in the Ho fish than in He fish. (B) Relative expression of the sGULO gene in Wt, He, and Ho fish muscles after 60 dpf. Plus “+” indicates those fed with AA, and the minus “–” indicates those fed without AA. The results were analyzed with ANOVA using Duncan’s test (p < 0.05) Different lowercase letters indicate a statistical difference in the mean value (n = 10).

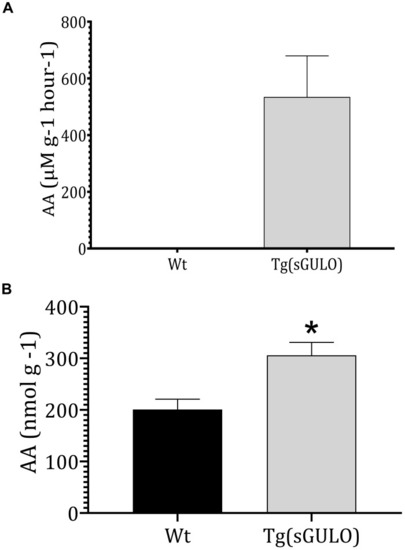
The sGULO enzyme activity and AA level in Wt and Tg fish. (A) Detection of sGULO activity in Tg and Wt fish. Whole zebrafish were homogenized and used to detect the endogenous enzyme activity. This experiment was performed using an Oxi Select AA detection kit. The production rate of AA in Wt and Tg fish was measured after the addition of gulonolactone. (B) Detection of the endogenous AA level in Wt and Tg fish. Whole zebrafish were homogenized and used to detect endogenous AA levels using an Oxi Select AA detection kit. The error bars represent the standard deviation associated with experimental triplicates. The statistical significance between the Wt and Tg groups was analyzed using a t-test, and the significance is indicated by an asterisk *p < 0.05.

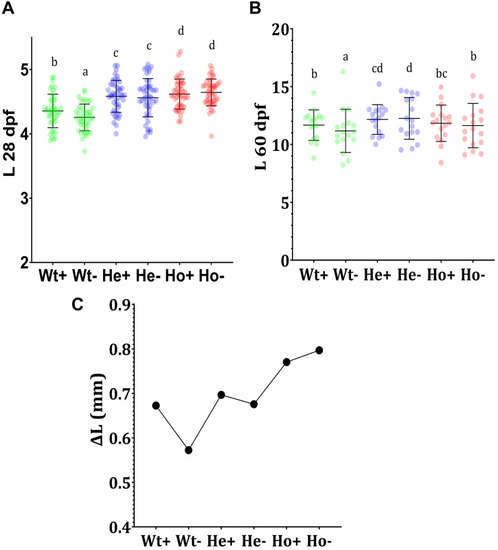
Feeding experiment and evaluation of growth Tg (b-actin:sGULO:mCherry) fish. (A) The length (mm) of Wt and Tg fish after the first 20 days of feeding (8–28 dpf), (B) The growth of the latter 30 days of feeding (30–60 dpf), and (C) the growth difference (ΔL) during the first 20 days of feeding. Every single point overlayed on the charts indicates an individual fish. Error bars represent the standard deviation of the individual body lengths. Data were analyzed with ANOVA using Duncan’s test (p < 0.5), and different lowercase letters indicate different significant levels between samples. Plus (+) and minus (-) labels indicate AA plus and absent meals, respectively.

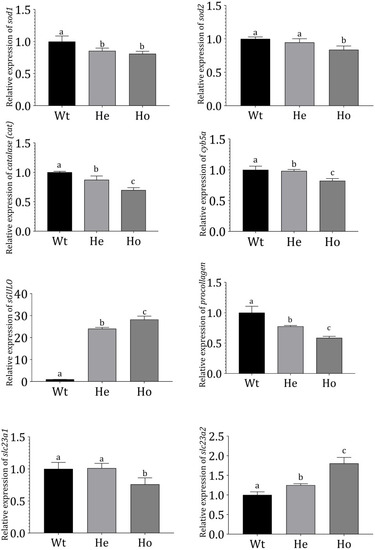
Gene expression profiles in Tg and Wt fish. Gene expression profiles of Wt and 3 dpf F2 Tg zebrafish (n = 50 for each sample). mRNA expression was measured using qRT-PCR and evaluated using the Livak method (Livak and Schmittgen, 2001). Danio rerio ef1-α expression was used as an internal control. Error bars represent the standard deviation of triplicate experiments. Data were analyzed with ANOVA using Duncan’s test (p < 0.05), and significant differences between Tg and Wt groups are indicated by different lowercase letters.

Acknowledgments
This image is the copyrighted work of the attributed author or publisher, and ZFIN has permission only to display this image to its users. Additional permissions should be obtained from the applicable author or publisher of the image. Full text @ Front. Physiol.