FIGURE SUMMARY
Title

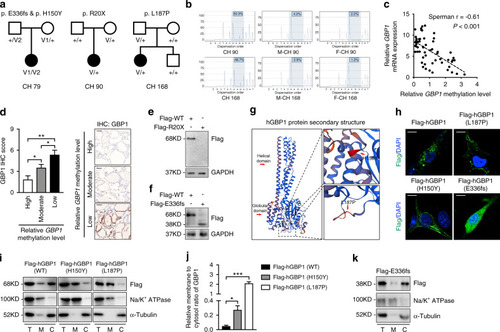
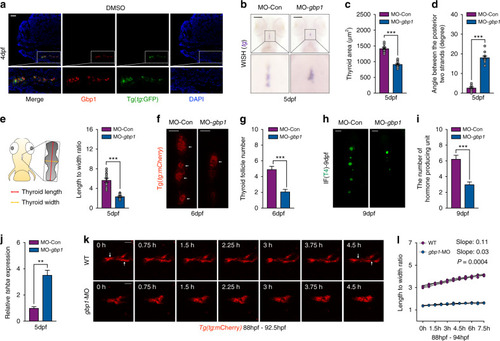
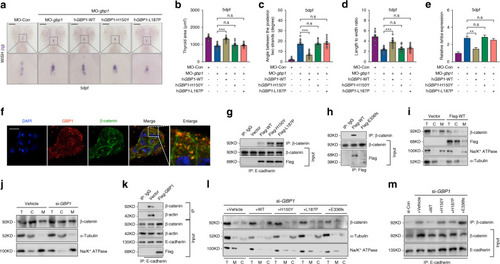
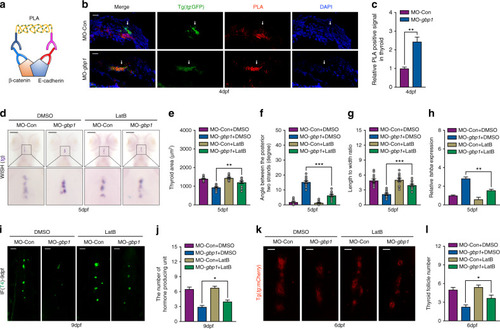
Upregulation of GBP1 in thyroid primordium is required for developmental thyroid morphogenesis

Authors
Yang, R.M., Zhan, M., Zhou, Q.Y., Ye, X.P., Wu, F.Y., Dong, M., Sun, F., Fang, Y., Zhang, R.J., Zhang, C.R., Yang, L., Guo, M.M., Zhang, J.X., Liang, J., Cheng, F., Liu, W., Han, B., Zhou, Y., Zhao, S.X., Song, H.D.
Source
Full text @ Genet. Med.

Identification of <italic>GBP1</italic> variations in congenital hypothyroidism (CH) patients.

(a) Transmission pattern of GBP1 variations in three pedigrees. Proband 79 (CH 79) carried compound heterozygous variations (p.H150Y and p.E336fs) inherited from the euthyroid father and mother respectively. Proband 90 (CH 90) carried heterozygous variation inherited from the euthyroid mother. Proband 168 (CH 168) carried a heterozygous variation (p.L187P). V variation, black solid box: proband. (b) The cg12054698 methylation status examined in CH 90, CH 168, and their parents by pyrosequencing. F father, M mother. Relative methylation level of the CpG site of each sample was labeled. (c) The correlation of cg12054698 methylation status with the messenger RNA (mRNA) levels of human GBP1 (hGBP1) in 57 normal thyroid tissues (Spearman r = −0.61, P < 0.001). (d) Left is the quantification of GBP1 expression by immunohistochemistry (IHC) classified by cg12054698 methylation level assessed by methylation-specific polymerase chain reaction (PCR). Right is the representative IHC staining of GBP1 in cg12054698 high, moderate, and low methylated thyroid tissues. Bars = 50 μm. (e) Western blot examination of the R20X mutated GBP1 expression in TPC1 cells. (f) Western blot confirmation of the truncated GBP1 caused by p.E336fs variation in TPC1 cells. (g) The position of the two missense variations of hGBP1 (H150Y and L187P) in the secondary structure of hGBP1 protein. (h) The cellular location of transfected Flag-hGBP1, Flag-hGBP1-H150Y, Flag-hGBP1-L187P, and Flag-hGBP1-E336fs in TPC1 cells by immunofluorescence assay. Scale bar: 10 μm. (i) The expression of Flag-hGBP1, Flag-hGBP1-H150Y, and Flag-hGBP1-L187P in the cell membrane and cytosol compartment detected by western blot. Na/K+ ATPase was used as a loading control for the membrane and α-tubulin for the cytosol fraction. (j) The ratios of hGBP1 expression in the membrane to that in the cytosol, calculated by gray value scan in three independent experiments. (k) Membrane cytosol extraction show the content of the mutated hGBP1 (p.E336fs) in each compartment. Na/K+ ATPase was used as a loading control for the membrane and α-tubulin for the cytosol fraction. Means ± SEM are shown for three independent experiments. *P < 0.05; **P < 0.01; ***P < 0.001; (Student’s t-test).

<italic>Gbp1</italic> knockdown led to hypothyroidism and thyroid developmental abnormalities in zebrafish embryos.

(a) Representative image showing the expression of Gbp1 in 4-dpf thyroid tissue under Tg(tg:GFP) background using immunofluorescence (IF) assay. (b) Whole-mount in situ hybridization (WISH) assessment of tg expression in gbp1 morphants at 5 dpf. (ce) Statistical calculation of thyroid area (c), angle between the posterior strands (d), and length to width ratio (e) in gbp1 morphants. N = 12. Left schematic illustration in (e) showing how the length and width of the zebrafish thyroid primordium (TP) is calculated. While the length is measured from the front point to the ending point of the TP along the pharyngeal midline, the width is the measured by the widest axis vertical to the length axis. (f, g) Representative image (f) and statistical analysis (g) of follicle formed with gbp1 knockdown under Tg(tg:mCherry) background. N = 12. Bars = 20 μm. (h,i) Representative image (h) and statistical analysis (i) of T4 producing units with gbp1 knockdown. N = 12. Bars = 20 μm. (j) Tshba transcripts detected in 5-dpf wild-type (WT) and gbp1 morphants. Means ± SEM are shown for three independent experiments. (k) Representative images chosen from Movie S1 and Movie S2 showing the differential growth mode of TP in 88 hpf−92.5 hpf WT and gbp1 deficient embryos. Bars = 20 μm. (l) Statistical calculation of the dynamic changes of the length to width ratio in WT and gbp1 morphants from 88 to 94 hpf. N = 3. The arrows indicate the separation of follicles after 4.5 h morphogenesis. **P < 0.01; ***P < 0.001 (Student’s t-test).

EXPRESSION / LABELING:
Genes:
Antibody:
Fish:
Knockdown Reagent:
Anatomical Terms:
Stage Range: Day 4 to Day 5

Functional impairment of <italic>GBP1</italic> variants identified in congenital hypothyroidism (CH) patients.

(a) The rescuing effects of co-expression of wild-type (WT) hGBP1 or mutated hGBP1 messenger RNA (mRNA) (hGBP1-H150Y or hGBP1-L187P) on thyroid development are displayed. Bars = 50 μm. (bd) Statistical analysis of the thyroid area (b), angle between two posterior strands (c), and length to width ratio (d) in WT and gbp1 morphants with WT or mutated hGBP1 mRNA overexpression. N = 12. (e) Rescuing effects tshba expression in zfgbp1 morphants with WT or mutated hGBP1 mRNA overexpression. Means ± SEM are shown for three independent experiments. (f) The expression of endogenous hGBP1 and β-catenin in TPC1 cells was detected by immunofluorescence. Bars = 20 μm. The enlarged image shows that hGBP1 colocalized with β-catenin in the cytoplasm of TPC1 cells. (g) Co-immunoprecipitation (Co-IP) assessment of the interaction between WT and mutated hGBP1 (p.H150Y, p.L187P) with β-catenin. (h) Co-IP assessment of the interaction between the truncated hGBP1 (p.E336fs) with β-catenin. (i) Western blot examination of cytosol and membrane β-catenin content with overexpression of N-terminal flag fused hGBP1. Na/K+ ATPase was used as a loading control for the membrane and α-tubulin for the cytosol fraction. (j) The effect of GBP1 knockdown in TPC1 cells on the content of cytosol and membrane β-catenin. Na/K+ ATPase was used as a loading control for the membrane and α-tubulin for the cytosol fraction. (k) The effect of introducing N-terminal flag fused GBP1 on the formation of adhesion complex in TPC1 cells. (l) Restoring effects of WT or mutated hGBP1 overexpression on the subcellular β-catenin levels in GBP1-deficient TPC1 cells. Na/K+ ATPase was used as a loading control for the membrane and α-tubulin for the cytosol fraction. (m) Rescuing effects of WT or mutated hGBP1 overexpression on cellular adhesion complex formation in GBP1-deficient TPC1 cells. Means ± SEM are shown for three independent experiments. n.s. not significant; **P < 0.01; ***P < 0.001 (Student’s t-test).

Cellular adhesion inhibition restored the abnormal thyroid primordium (TP) morphology in <italic>gbp1-</italic>deficient embryos.

(a) Cartoon image show the working model of Duolink PLA strategy. (b,c) Representative images (b) and statistical assessment (c) of the β-catenin and E-cadherin interaction pattern in 4-dpf wild-type (WT) and gbp1 deficient embryos under Tg(tg:GFP) background. Means ± SEM of the three independent experiments are shown. (dg) Representative image showing tg expression pattern (d), statistical analysis of the thyroid area (e), angle between two posterior strands (f), and length to width ratio (g) in WT and gbp1 morphants with or without LatB addition. N = 12. (h) Restoring effects on tshba expression in WT and gbp1 morphants with or without LatB addition. Means ± SEM of the three independent experiments are shown. (i,j) Representative image (i) and statistical analysis (j) showing the rescuing effects of LatB treatment on follicle number in gbp1 morphants under Tg(tg:mCherry) transgenic background. N = 12. Bars = 20 μm. (k,l) Representative image (k) and statistical analysis (l) showing the rescuing effects of LatB treatment on T4 containing units in gbp1 morphants by immunofluorescence (IF) assay. *P < 0.05; **P < 0.01; ***P < 0.001 (Student’s t-test).

ZFIN is incorporating published figure images and captions as part of an ongoing project. Figures from some publications have not yet been curated, or are not available for display because of copyright restrictions.

EXPRESSION / LABELING:
Gene:
Fish:
Anatomical Terms:
Stage Range: Long-pec to Day 5

ZFIN is incorporating published figure images and captions as part of an ongoing project. Figures from some publications have not yet been curated, or are not available for display because of copyright restrictions.

Acknowledgments
This image is the copyrighted work of the attributed author or publisher, and ZFIN has permission only to display this image to its users. Additional permissions should be obtained from the applicable author or publisher of the image. Full text @ Genet. Med.