
- Title
-
Induced Torpor as a Countermeasure for Low Dose Radiation Exposure in a Zebrafish Model
- Authors
- Cahill, T., da Silveira, W.A., Renaud, L., Williamson, T., Wang, H., Chung, D., Overton, I., Chan, S.S.L., Hardiman, G.
- Source
- Full text @ Cells
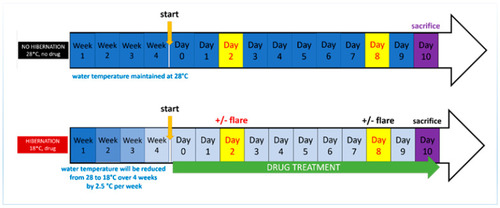
Experiment timeline shows the radiation group (top) maintained at 28.5 °C, receiving radiation on the 2nd and 8th day prior to sacrifice on the 10th day. The torpor + radiation group (bottom) was lower temperature acclimatised over 4 weeks, when 18.5 °C was reached they also received 24 µM of melatonin daily for 10 days. Radiation exposure was administered on the 2nd and 10th day prior to sacrifice on the 10th day. |
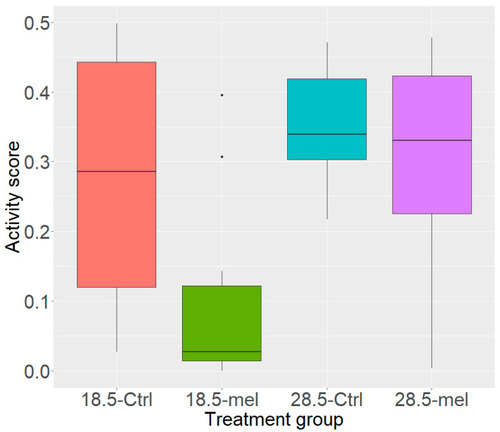
Activity Scores. The control group (28.5-Ctrl) inhabited all areas of the beaker. The torpor group (18.5-mel, q = 0.002) had a significantly lower activity score than either control or temperature group (28.5-Ctrl, 18.5-Ctrl, q = 0.030). Lowering temperatures alone (18.5-Ctrl, q = 0.030) reduced activity while the melatonin group (28.5-mel, q = 0.538) did not significantly reduce activity. |
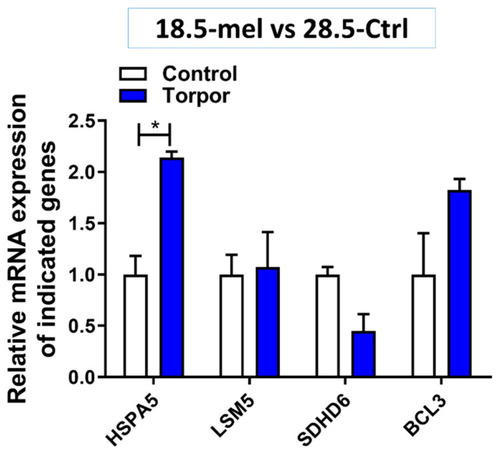
Gene expression in the torpor (18.5-mel) group compared to that in the control (28.5-Ctrl) group. The figure shows the relative increase in expression of HSPA5 (p = 0.013) and while not significant BCL3 expression (p = 0.107) is also increased. It also demonstrates an almost significant decrease in expression of SDHD6 (p = 0.05) compared with control, supporting the results from DE analysis. * p < 0.05. |
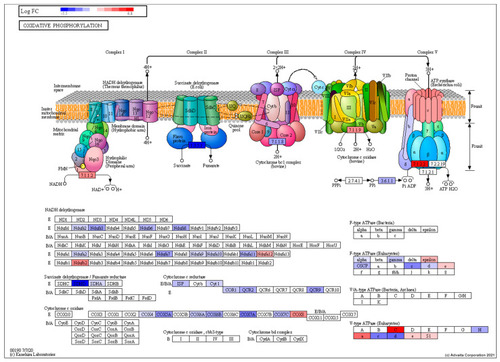
Pathway topological diagram of the oxidative phosphorylation pathway produced by KEGG showing differentially expressed genes from a comparison between the torpor and control group showing the torpor group experienced an overall downregulation of several key subunits of electron transport chain proteins such as NADH dehydrogenase, succinate dehydrogenase and cytochrome c oxidase, indicating reduced energy production. RED: upregulated, BLUE: downregulated. |
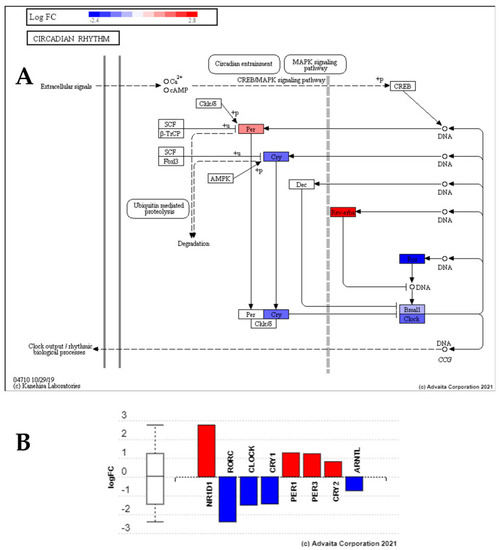
Perturbation of circadian rhythm pathway genes from exposure to low dose radiation compared to control group. This reveals upregulation of Per and Rev-Erba, and the downregulation of Cry, Clock, Bmal and Arntl in comparison to the control group (28.5-Ctrl), suggesting low dose radiation perturbs the circadian rhythm. (A) Pathway topological diagram showing position and regulation of differentially expressed circadian rhythm genes. RED: upregulated, BLUE: downregulated. (B) Bar chart showing fold change of differential expression of the key clock genes. |
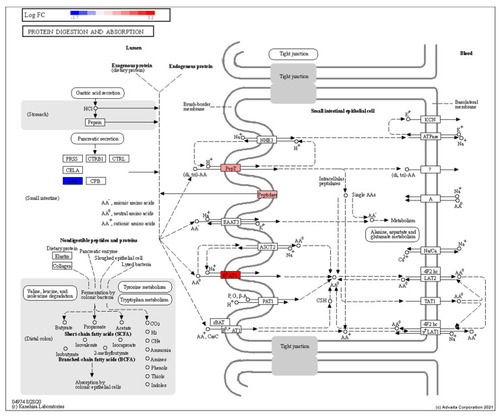
Topological diagram of the protein digestion and absorption pathway showing the upregulation (28.5-Rad vs 28.5-Ctrl) of peptidases and amino acid transporters on the brush border membrane in response to low dose radiation exposure RED: upregulated, BLUE: downregulated. |
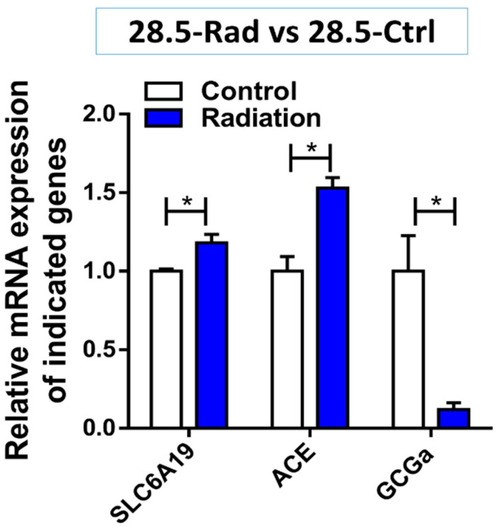
Gene expression in the radiation (28.5-Ctrl) group compared with control (28.5-Ctrl). The figure shows the increase in expression of SLC6A19 transporter (p = 0.041) and the angiotensin system gene ACE (p = 0.022) while GCGa involved in increasing blood sugar levels is downregulated (p = 0.032) compared to the control. * p < 0.05. |
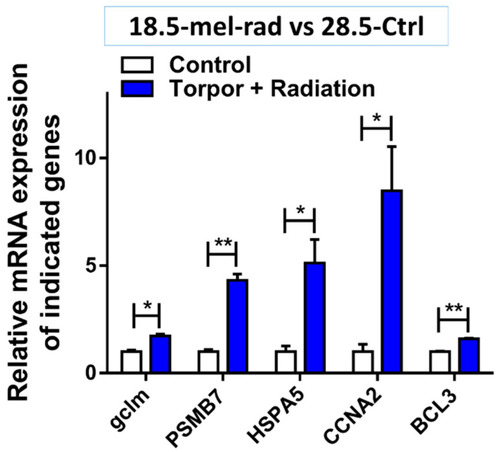
Validation of gene expression in the torpor + radiation (18.5-mel-rad) group compared with control (28.5-Ctrl). The figure shows the increase in expression of GCLM (p = 0.011), PSMB7 (p = 0.004), HSPA5 (p = 0.035), CCNA2 (p = 0.036) and BCL3 (p = 0.001911), relative to the control (28.5-Ctrl) involved in glutathione metabolism, proteasome complex, protein refolding, cell cycle and anti-apoptosis, respectively. * p < 0.05, ** p < 0.001. |
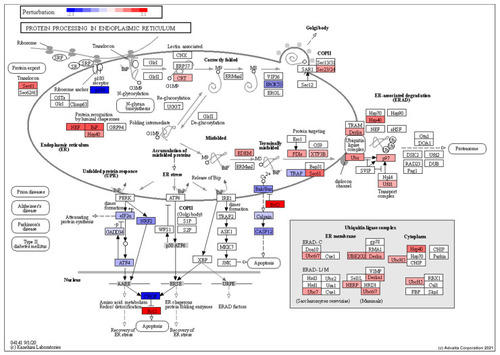
Perturbation of genes encoding proteins involved in ER-associated protein degradation showing an increase in expression of chaperones involved in detecting misfolded proteins (NEF, BiP, Hsp40), as well as those involved in the ER-associated degradation pathway (Derlin, UBx). This also shows an increase in anti-apoptotic genes (BCL2) and a decrease in pro-apoptotic genes (Casp12). RED: upregulated, BLUE: downregulated. |
Integrated networks of the radiation (28.5-rad) and the torpor+radation group (18.5-mel-rad) generated by NetNC analysis. Fold change values for the radiation group are shown by node fill colour, values for torpor + radiation are represented by the shape border colour. Node shapes indicate: NetNC-predicted coherent genes in both groups (rectangular), in the radiation group only (oval), in the torpor + radiation group only (diamond) and changed in opposite directions (triangular). Results from each condition show very substantial overlap, with some notable differences being the upregulation of genes in the torpor + radiation group (18.5-mel-rad vs. 28.5-Ctrl) that confer radio-resistance (TXN, GSTP1) and promote survival (HMGB1). |