FIGURE SUMMARY
Title

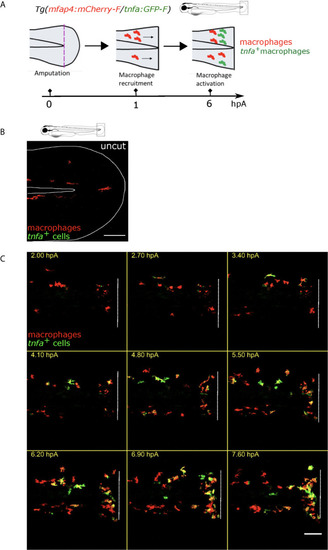
Damage-Induced Calcium Signaling and Reactive Oxygen Species Mediate Macrophage Activation in Zebrafish

Authors
Sipka, T., Peroceschi, R., Hassan-Abdi, R., Groß, M., Ellett, F., Begon-Pescia, C., Gonzalez, C., Lutfalla, G., Nguyen-Chi, M.
Source
Full text @ Front Immunol

Tg(mfap4:mCherry-F/tnfa:GFP-F) reporter line allows imaging of macrophage M1-like activation at the wound in response to fin fold injury. (A) The caudal fin fold of Tg(mfap4:mCherry-F/tnfa:GFP-F) larvae were amputated at 3 dpf. Schedule of the recruitment and M1-like activation of macrophages at the wound after the fin fold injury. (B) Representative image of uncut zebrafish fin fold. Maximum projection of the overlaid fluorescence of mCherry-F (macrophages) and GFP-F (tnfa+ cells). The white line outlines the fin fold and the notochord. Scale bar: 100 μm. (C) Macrophage movements and activation states were imaged by confocal microscopy from 1.5 to 9.5 hours post amputation (hpA) using the tg(mfap4:mCherry-F/tnfa:GFP-F) line. Tail images are representative maximum projections of the overlaid fluorescences of mCherry-F (macrophages) and GFP-F (tnfa+ cells), showing M1-like activation of recruited macrophages at the wound, starting from 3 hpA and increasing up to 7.6 hpA. Dashed line indicates the wound margin. Scale bar: 100 μm.

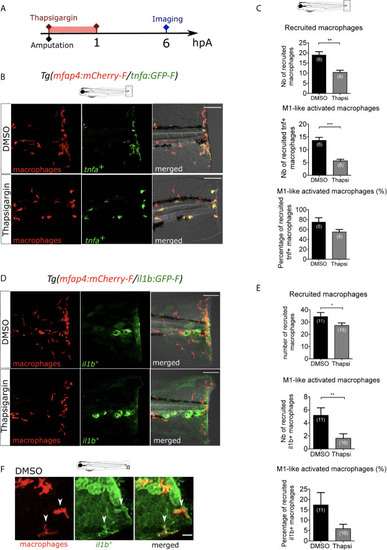
Intracellular Ca2+ signaling mediates macrophage recruitment and activation. (A) Schedule of the experiment. Immediately after the fin fold amputation at 3 dpf, Tg(mfap4:mCherry-F/tnfa:GFP-F) or Tg(mfap4:mCherry/il1b:GFP) larvae were treated with Thapsigargin or DMSO for 1 h. Thapsigargin was removed and larvae were imaged at 6 hours post amputation (hpA) using confocal microscopy. (B) Tail images are representative maximum projections of the fluorescence of mCherry-F (macrophages), GFP-F (tnfa+ cells) and merged channel images of Tg(mfap4:mCherry-F/tnfa:GFP-F) injured larvae, after the treatment with DMSO (up) or Thapsigargin (down) at 6 hpA. Scale bars: 100 μm. (C) Quantification of recruited macrophages (up) and tnfa+ recruited macrophages (middle) after the DMSO and Thapsigargin treatments at 6 hpA. The lower graph represents the percentage of tnfa+ macrophages in the recruited population. Representative experiment of three independent experiments, mean ± SEM, nlarvae is indicated in brackets, Mann Whitney test, two-tailed, **p<0.01, ***p<0.001. (D) Tail images are representative maximum projections of the fluorescence of mCherry-F (macrophages), GFP-F (il1b+ cells) and merged channel images with brightfield of Tg(mfap4:mCherry/il1b:GFP) injured larvae after the treatment with DMSO (up) or Thapsigargin (down) at 6 hpA. Scale bars: 100 μm. (E) Quantification of recruited macrophages (up) and il1b+ recruited macrophages (middle) after the DMSO and Thapsigargin treatments at 6 hpA. The lower graph represents the percentage of il1b+ macrophages in the recruited population. Two independent experiments merged, mean ± SEM, nlarvae is indicated in brackets, one-tailed t-test with Welch’s correction, *p<0.05, **p<0.01. (F) Representative zoomed maximum projections of the fluorescence of mCherry-F (macrophages) and GFP-F (il1b+ cells) merge channels images in injured fin fold of Tg(mfap4:mCherry/il1b:GFP) at 6hpA after the treatment with DMSO. Arrow heads show the overlap between GFP and mCherry signal in macrophages. Scale bar: 20 μm.

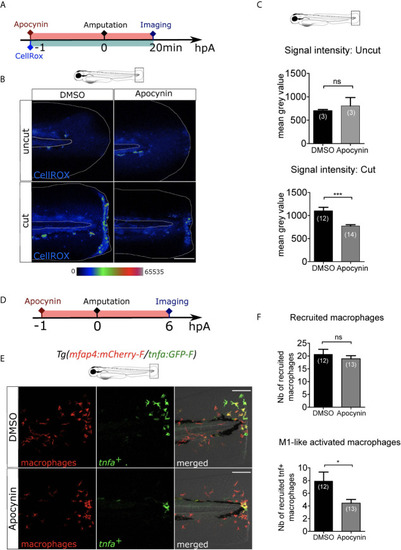
ROS release at the wound mediate macrophage activation but not recruitment. (A) Schedule of the experiment. 1h before the fin fold injury at 3 dpf, larvae were incubated in Apocynin or DMSO, containing CellROX solution for the detection of the ROS production. Drug and staining were both removed at 20 min pA, and larvae were immediately imaged using epi-fluorescent microscopy. (B) Representative images of the CellROX fluorescence in uncut or cut fin folds, after the treatment with DMSO or Apocynin at 20 min pA. Rainbow color scale was applied to images, emphasizing the differences in signal intensity. The white lines outline the fin fold and the notochord. Scale bar: 100 μm. (C) Quantification of signal intensity of the CellROX fluorescence by mean gray value. Representative experiment of two independent experiments, mean ± SEM, nlarvae is indicated in brackets, upper graph: Mann Whitney test, two-tailed, ns – not significant, bottom graph: one-tailed t-test with Welch’s correction, ***p<0.001. (D) Schedule of the experiment. From 1 h before the fin fold amputation at 3 dpf, until 6 hpA, Tg(mfap4:mCherry-F/tnfa:GFP-F) larvae were incubated in Apocynin or DMSO, and then imaged at 6 hpA using confocal microscopy. (E) Tail images are representative maximum projections of the fluorescence of mCherry-F (macrophages), GFP-F (tnfa+ cells) and merged channel images with brightfield after the treatment with DMSO (up) or Apocynin (down) at 6 hpA. Scale bars: 100 μm. (F) Quantification of recruited macrophages (up) and tnfa+ recruited macrophages (down) after DMSO and Apocynin treatments at 6 hpA. Representative experiment of two independent experiments, mean ± SEM, nlarvae is indicated in brackets, one-tailed t-test with Welch’s correction, *p<0.05.

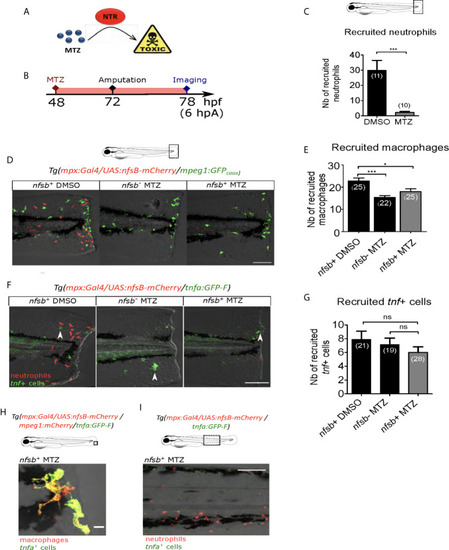
Neutrophil presence at the wound is not necessary for macrophage activation. (A) Mechanism of action of the prodrug metronidazole (MTZ) that is converted into a cell-autonomous toxic molecule in the presence of nitroreductase (NTR). Specific expression of NTR within neutrophils leads to the depletion and immobilization of larval neutrophils. (B) Schedule of the experiment. At 48 hpf Tg(mpx:Gal4/UAS:nfsB-mCherry/tnfa:GFP-F) or Tg(mpx:Gal4/UAS:nfsB-mCherry/mpeg1:GFP-caax) larvae were treated with metronidazole (MTZ) and maintained in the drug until the end of the experiment. Transgenic larvae treated with DMSO and WT siblings treated with MTZ were used as controls. At 3 dpf, fin folds were injured and larvae were imaged at 6 hpA using confocal microscopy. (C) Quantification of recruited neutrophils at the wound at 6 hpA, after the treatment with MTZ or DMSO. Representative experiment of three independent experiments, mean ± SEM, nlarvae is indicated in brackets, one-tailed t-test with Welch’s correction, ***p<0.001. (D)Tg(mpx:Gal4/UAS:nfsB-mCherry/mpeg1:GFP-caax) treated with DMSO (nfsb+ DMSO) or with MTZ (nfsb+ MTZ) and WT siblings with MTZ (nfsb- MTZ). Tail images are representative maximum projections of the fluorescence of mCherry-F (neutrophils), GFP-caax (macrophages) and merged channel images with brightfield at 6 hpA. Scale bar: 100 μm. (E) Quantification of recruited macrophages at the wound at 6 hpA, after the treatment with MTZ or DMSO. Representative experiment of two independent experiments, mean ± SEM, nlarvae is indicated in brackets, upper graph: one-way ANOVA, *p<0.05 ***p<0.001. (F)Tg(mpx:Gal4/UAS:nfsB-mCherry/tnfa:GFP-F) treated with DMSO (nfsb+ DMSO) or with MTZ (nfsb+ MTZ+) and WT siblings with MTZ (nfsb- MTZ+). Tail images are representative maximum projections of the fluorescence of mCherry-F (neutrophils), GFP-F (tnfa+ cells, selected by arrow heads) and merged channel images with brightfield at 6 hpA. Scale bar: 100 μm. (G) Quantification of recruited tnfa+ cells at the wound at 6 hpA in indicated conditions. Two independent experiments merged, mean ± SEM, nlarvae is indicated in brackets, Kruskal-Wallis test, ns: not significant. (H) Quadruple transgenic line Tg(mpx:Gal4/UAS:nfsB-mCherry/mfap4:mCherry/tnfa:GFP-F) treated with MTZ and imaged at 6hpA. Image is the representative zoomed and overlaid maximum projections showing the overlap of the fluorescence of mCherry-F (macrophages) and GFP-F (tnfa+ cells), in the absence of neutrophils at the wound. Scale bar: 10 μm. (I)Tg(mpx:Gal4/UAS:nfsB-mCherry/tnfa:GFP-F) larvae treated with MTZ and imaged at 6hpA in the CHT region. Image is a representative maximum projection of mCherry and GFP-F fluorescences overlaid with brightfield image, showing no potential tnfa (GFP-F+ cells) expressed in the vicinity of neutrophils (mCherry+ cells) upon MTZ treatment. Scale bar: 100 μm.

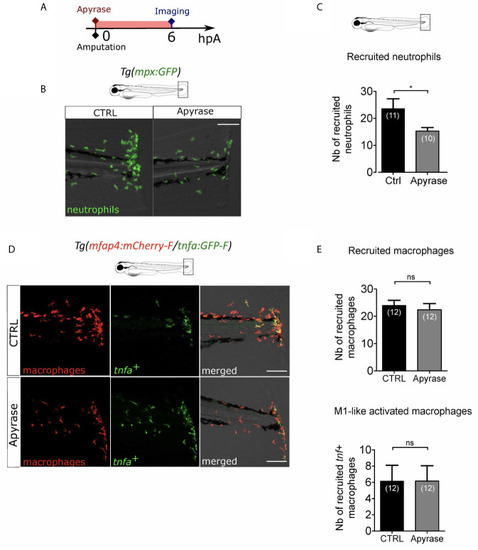
Extracellular ATP is not necessary for macrophage activation. (A) Schedule of the experiment. Fin folds from Tg(mpx:GFP) or Tg(mfap4:mCherry-F/tnfa:GFP-F) were injured at 3 dpf and larvae were immediately incubated in zebrafish water containing or not Apyrase and imaged at 6 hpA using epi-fluorescent or confocal microscopy. (B) Tail images are representative overlays of GFP fluorescence (neutrophils) and brightfield image. Images were acquired at 6 hpA by epi-fluorescent microscopy from Tg(mpx:GFP) larvae either untreated or treated with Apyrase. Scale bar: 100 μm. (C) Quantification of neutrophils recruited at the wound at 6hpA. Representative experiment of two independent experiments, mean ± SEM, nlarvae is indicated in brackets, one-tailed t-test with Welch’s correction, *p<0.05. (D) Tail images are representative maximum projections of the fluorescence of mCherry-F (macrophages), GFP-F (tnfa+ cells) and merged channel images with brightfield of Tg(mfap4:mCherry-F/tnfa:GFP-F) injured larvae after no treatment (control, up) or Apyrase treatment (down) at 6 hpA. Scale bars: 100 μm. (E) Quantification of recruited macrophages (up) and tnfa+ recruited macrophages (down) in controls and in Apyrase treated larvae at 6 hpA. Representative experiment of two independent experiments, mean ± SEM, nlarvae is indicated in brackets, upper graph: t-test, two-tailed, ns- not significant; bottom graph: Mann Whitney test, two-tailed, ns - not significant.

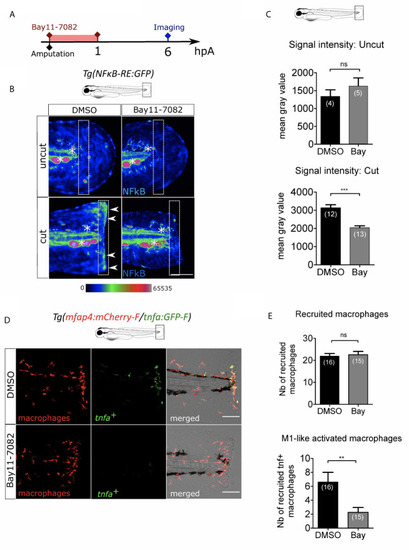
NFκB pathway is enrolled in macrophage activation after wounding. (A) Schedule of the experiment. Fin folds from Tg(NFκB-RE : GFP) or Tg(mfap4:mCh-F/tnfa:GFP-F) were amputated at 3 dpf and immediately treated either with DMSO or Bay11-7082 during 1 h. The drug was removed and larvae were imaged at 6 hpA using epi-fluorescent or confocal microscopy. (B) Representative images of the GFP fluorescence in uncut or cut fin folds from Tg(NFκB-RE : GFP) at 6 hpA, after the treatment with DMSO or Bay11-7082, detecting the NF-κB activation. Rainbow color scale was applied to images, emphasizing the differences in signal intensity. Asterisks show GFP signal in neuromast that is independent on NF-κB signaling. Arrow heads show NF-κB -dependent GFP signal at the wound edge. The white boxes outline the region of quantification. Scale bar: 100 μm. (C) Quantification of signal intensity of GFP fluorescence by mean gray value. Representative experiment of two independent experiments, mean ± SEM, nlarvae is indicated in brackets, upper graph: Mann Whitney test, two-tailed, bottom graph: one-tailed t-test, ***p<0.001. (D) Tail images are representative maximum projections of the fluorescence of mCherry-F (macrophages), GFP-F (tnfa+ cells) and merged channel images with brightfield of Tg(mfap4:mCh-F/tnfa:GFP-F) injured larvae after DMSO or Bay11-7082 treatment at 6 hpA. Scale bars: 100 μm. (E) Quantification of recruited macrophages (up) and tnfa+ recruited macrophages (middle) in controls and in DMSO or Bay11-7082 treated larvae at 6 hpA. Representative experiment of three independent experiments, mean ± SEM, nlarvae is indicated in brackets, upper graph: two-tailed t-test, ns – not significant, bottom graph: two-tailed t-test with Welch’s correction, **p<0.01.

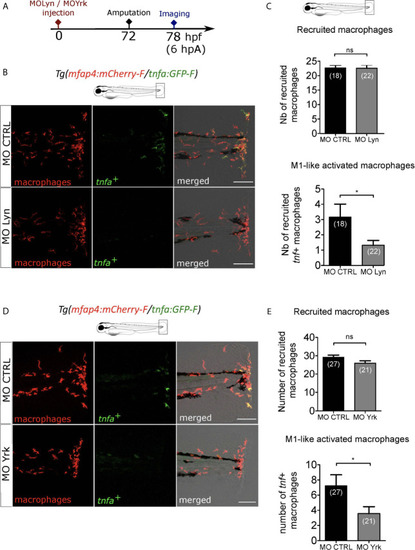
Macrophage-expressed SFKs Lyn and Yrk are enrolled in macrophage activation. (A) Schedule of the experiment. Morpholinos targeting specifically lyn (MO Lyn) or yrk (MO Yrk) or morpholino control (MO CTRL) were injected in Tg(mfap4:mCherry/tnfa:GFP-F) at one-cell stage. At 3 dpf, fin folds were amputated and larvae were imaged at 6 hpA using confocal microscopy. (B) Tail images are representative maximum projections of the fluorescence of mCherry-F (macrophages), GFP-F (tnfa+ cells) and merged channel images with brightfield at 6 hpA, after the injection of MO CTRL (up) or MO Lyn (down). Scale bar: 100 μm. (C) Quantification of recruited macrophages (up) and tnfa+ recruited macrophages (down) in controls and in Lyn morphants at 6 hpA. Two independent experiments merged, mean ± SEM, nlarvae is indicated in brackets, upper graph: two-tailed t-test, ns – not significant, bottom graph: Mann Whitney test, two-tailed, *p<0.05. (D) Tail images are representative maximum projections of the fluorescence of mCherry-F (macrophages), GFP-F (tnfa+ cells) and merged channel images with brightfield at 6 hpA, after the injection of MO CTRL (up) or MO Yrk (down). Scale bar: 100 μm. (E) Quantification of recruited macrophages (up) and tnfa+ recruited macrophages (down) in controls and in yrk morphants at 6 hpA. Two independent experiments merged, mean ± SEM, nlarvae is indicated in brackets, two-tailed t-test, ns – not significant, *p<0.05.

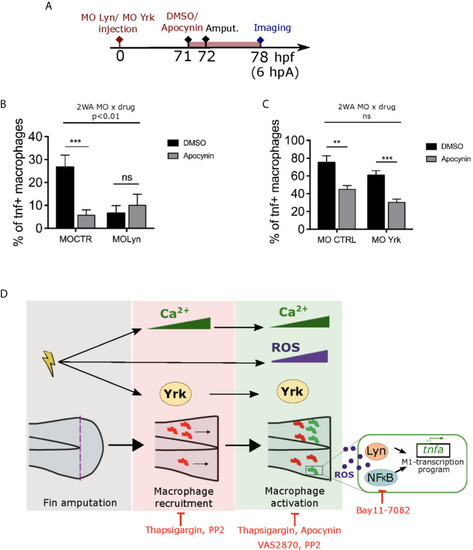
ROS interact with Lyn but not Yrk to mediate macrophage M1-like activation. (A) Schedule of the experiment. Morpholinos targeting specifically lyn (MO Lyn) or yrk (MO Yrk) or morpholino control (MO CTRL) were injected in Tg(mfap4:mCherry/tnfa:GFP-F) at one-cell stage. At 3 dpf (71 hpf), larvae were treated with Apocynin or DMSO, 1 hour before fin fold amputation. At 6 hpA, tails were imaged using confocal microscopy. (B) Quantification of the percentage of tnfa+ macrophages in the recruited macrophage population at 6 hpA in CTRL morphants or lyn morphants which were either treated with DMSO or Apocynin (mean ± SEM, nlarvae is indicated in brackets). A significant interaction between morpholino and drug effect was determined by two-way ANOVA (2WA, **p<0. 01, F(1, 42) = 8.305). Then Mann Whitney test, two-tailed was performed to determine the significant difference between DMSO and Apocynin groups (ns-not significant, ***p<0.001). (C) Quantification of the percentage of tnfa+ macrophages in the recruited macrophage population at 6 hpA in CTRL morphants or yrk morphants which were treated with DMSO or Apocynin. (Representative experiment of two independent experiments, mean ± SEM, nlarvae is indicated in brackets). No significant (ns) interaction between morpholino and drug effect was determined by two-way ANOVA (2WA, F(1,29)=0.0002613). Then Mann Whitney test, two-tailed was performed to determine the significant difference between DMSO and Apocynin groups (**p<0.01, ***p<0.001). (D) A proposed model showing the role of early wound signals in macrophage activation. Fin fold amputation triggers different independent stimuli: 1/intracellular Ca2+ oscillations in epithelial cells at the wound margin, which further mediate both macrophage recruitment and pro-inflammatory activation. 2/ROS production (mainly H2O2) at the wound, which promotes macrophage pro-inflammatory activation and tnfa expression. 3/Activation of SFK Yrk, which promotes both macrophage recruitment and activation in an independent manner. Redox-sensitive transcription factor NFκB and SFK Lyn are activated by ROS and required for M1-like activation at the wound. Thapsigargin and PP2 treatments impair both macrophage recruitment and M1-like activation. Apocynin, VAS2870 and Bay11-7082 affect only macrophage M1-like activation.

Acknowledgments
This image is the copyrighted work of the attributed author or publisher, and ZFIN has permission only to display this image to its users. Additional permissions should be obtained from the applicable author or publisher of the image. Full text @ Front Immunol