
- Title
-
Zebrafish mafbb Mutants Display Osteoclast Over-Activation and Bone Deformity Resembling Osteolysis in MCTO Patients
- Authors
- Han, Y., Shao, W., Zhong, D., Ma, C., Wei, X., Ahmed, A., Yu, T., Jing, W., Jing, L.
- Source
- Full text @ Biomolecules
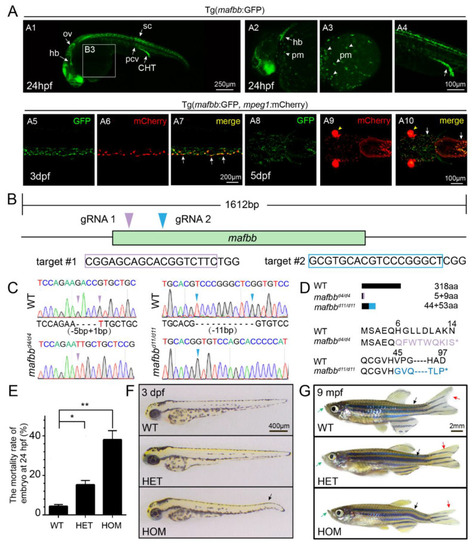
The expression of mafbb during embryogenesis and generation of mafbb mutants. (A) Tg (mafbb:GFP) shows mafbb expression in primitive myeloid (pm) cells, hindbrain (hb), otic vesicle (ov), spinal cord (sc), posterior cardinal vein (pcv), caudal hematopoietic tail region (CHT) (A1–4). A2–4 are enlarged images of A1. The white arrowheads in A2 and A3 point to pm cells. The double Tg(mafbb:GFP;mpeg1:mCherry) shows the expression of GFP in mCherry+-macrophages in the CHT (A5–7, lateral views) and in the head region (A8–10, ventral views). The white arrows in (A7 and A10) point to the overlapped expression of mafbb and mepg1. The arrowheads in (A9–10) mark the eyes from α-crystallin-mCherry in the plasmid of mabb:GFP [32]. (B) The schematic diagram of mafbb cDNA and the targeted regions of two guide RNAs. The target DNA sequences are shown in purple or blue rectangles. (C) Sanger sequencing analysis of PCR fragments containing gRNA1 and gRNA2 targeted regions from mafbb deficient homozygotes. The deleted nucleotides are replaced by -, and the inserted nucleotides are in red. (D) Schematic representation and amino acid sequence of the wild type MafBb and two predicted truncated proteins. (E) The mortality rate of embryos at 24 hpf (n = 315–688 per group). Results are expressed as mean ± SEM, (* p < 0.05, ** p < 0.01, t test). The statistical significance was displayed as (F) Images of embryos at 3 dpf. The black arrow points to the curved tail. (G) Images of adult zebrafish at 9 mpf. The projecting lower jaw (green arrows), the curved spine (black arrows) and the asymmetric caudal fin (red arrows) are shown in mafbb−/− mutants. WT, wild type; HET, mafbbd11/+; HOM, mafbbd11/d11; mpf, month post fertilization. |
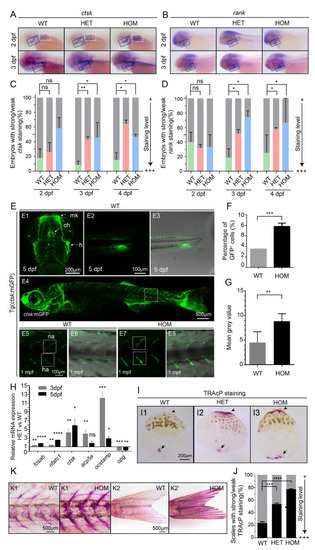
Overproduction of osteoclast cells in mafbb mutants. (A,B) WISH of ctsk and rank in embryos at 2–3 dpf. Black boxes indicate the pharyngeal arches; white boxes indicate the pectoral fins. (C,D) Quantification of the ctsk and rank expression during the early stages of development. 30–50 embryos were examined for each group. (E) Fluorescent images of Tg(ctsk:mGFP) at 5 dpf (E1–3) and 1 mpf (E4–6) in WT embryos, and at 1 mpf in HOM embryos (E7,8). E1, the ventral view of the head; Meckel’s cartilage (mk), ceratohyal (ch), hyosymplectic (h); E2, the lateral view of the tail; E3, overlay of E2 and transmitted light brightfield image; E4, the lateral view of 1 mpf Tg (ctsk:mGFP); E5–8, higher magnifications of boxed area in E4, neural arch (na); hemal arch (ha); E6 and E8, overlay of fluorescence and transmitted light brightfield image; E5,6, WT; E7,8, HOM. (F) Quantification of ctsk-GFP+cells in embryos by flow cytometry in Tg (ctsk:GFP) embryos at 5 dpf. (G) Mean grey value of GFP fluorescence intensity in the white boxes in E5 and E7. 3 fish were analyzed for each group. (H) Relative expression of genes involved osteoclast development (fosab; nfatc1; ctsk; acp5a; ocstamp; opg) in ctsk-GFP+ cells sorted from WT and HET embryos at 3–5 dpf. (I) Representative images of TRAcP histochemical staining on scales from adult zebrafish. The arrows and arrowheads point to the increased TRAcP activity, and the arrowheads point to the scale border. (J) Summary of the scales from different adult zebrafishes with TRAcP staining (n = 296–488 scales from 3 zebrafish per group; weak staining as in I1, strong staining as in I2,3 with increased TRAcP coloring along the scale border). (K) TRAcP staining of 2 mpf zebrafish. Vertebral columns (K1&K1′) and caudal fins (K2&K2′). 3 zebrafish were examined for each group with a consistent phenotype. WT, wild type; HET, mafbbd11/+; HOM, mafbbd11/d11. Results in C, F, G, H and J are expressed as mean ± SEM, (* p < 0.05, ** p < 0.01, *** p < 0.001, **** p < 0.0001, t test, ns, not significant). PHENOTYPE:
|
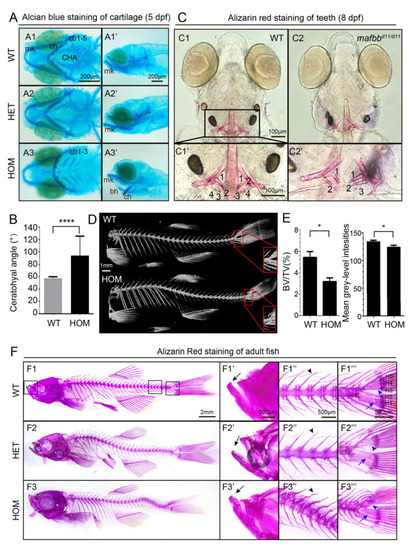
Abnormal cartilage and bone formation in mafbb mutants. (A) Alcian Blue staining of embryos at 5 dpf. A1-A3, ventral views; A1′-A3′, lateral views. Ceratobranchial pairs (cb); ceratohyal (ch); Meckel’s cartilage (mk); basihyal (bh), CHA (ceratohyal angel). (B) Summary of CHA in embryos at 5 dpf (n = 15 embryos per group). (C) Ventral views of Alizarin Red (AR) staining of larvae at 8 dpf. C1′ and C2′ are the enlarged images of the teeth region (n = 30 embryos per group). (D) MicroCT scans of adult zebrafish at 10 mpf. The hypurals in the red boxed area are used for analysis in E. (E) Summary of BV/TV for the bones in the boxed area in D (n = 3 zebrafish per group); mean grey-level intensities of the boxed area in D. (F) AR staining of adult zebrafish at 9 mpf. F1′–F3′″ are higher magnifications of boxed area in F1–F3. Mouths (F′), vertebral columns (F″) and caudal fins (F′″). The black arrows in F1′–F3′ point to the lower jaw; the black arrowheads in F2″-F3″ point to the neural arches; the blue arrowheads in F1′″–F3′″ point to hypurals 3–5 (H3–5); The blue arrows point to H1,2; N = 3 zebrafish per group. WT, wild type; HET, mafbbd11/+; HOM, mafbbd11/d11; BV, bone volume; TV, total tissue volume. Results in B and E are expressed as mean ± SEM, (* p < 0.05, **** p < 0.0001, t test). |
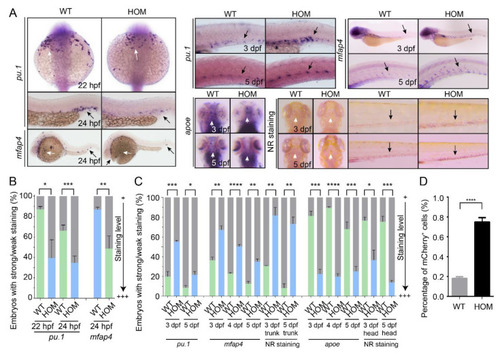
Macrophage development in WT and mafbb mutant embryos. (A) WISH of pu.1, mfap4 and apoe in embryos at 22–24 hpf. WISH of pu.1, mfap4 and apoe, neutral red (NR) staining in embryos at 3–5 dpf. The white arrows point to the rostral blood island and yolk sac, the black arrows point the ventral tail region. (B) Quantification of WISH results in embryos at 22–24 hpf (n = 50–100 embryos per group). (C) Quantification of WISH and NR staining in embryos at 3–5 dpf (n = 50–100 embryos per group). (D) Quantification of mCherry+ macrophage cells from Tg(mpeg1:mCherry) embryos at 5 dpf by flow cytometry. WT, wild type; HOM, mafbbd11/d11. Results in B-D are expressed as mean ± SEM, (* p < 0.05, ** p < 0.01, *** p < 0.001, **** p < 0.0001, t test). EXPRESSION / LABELING:
PHENOTYPE:
|
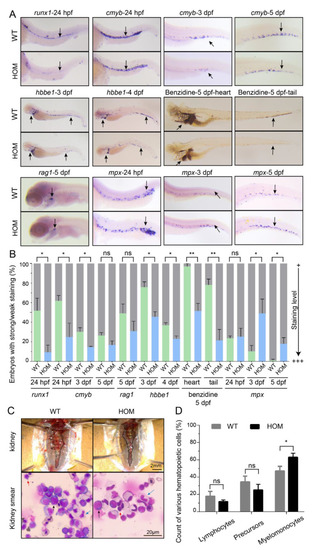
Expansion of definitive myeloid lineages in mafbb mutants. (A) WISH of runx1, cmyb, mpx, rag1 and hbbe1, and benzidine staining of embryos during the early development stages. (B) Quantification of WISH and benzidine staining results in embryos (n = 50–100 embryos per group). (C) Images of the kidney in adult zebrafish. May-Grunwald and Giemsa (MGG) staining of the whole kidney marrow (WKM) blood smears from zebrafish at 9-month-old. Myelomonocytes (blue arrows); lymphocytes (red arrows); precursors (black arrows). (D) Summary of various hematopoietic cells from adult WKM. 3 zebrafishes and about 2000 cells in total were analyzed for each group. WT, wild type; HOM, mafbbd11/d11. Results in B and D are expressed as mean ± SEM, (* p < 0.05, ** p < 0.01, t test, ns, not significant). PHENOTYPE:
|
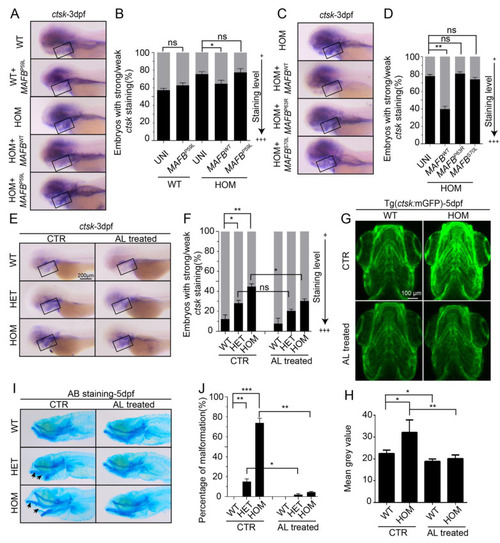
Rescue of mafbb−/− embryos by WT and MCTO mutant MAFB and alendronate. (A) WISH of ctsk expression at 3 dpf in WT uninjected embryos, WT embryos injected with human P59L mutant MAFB mRNA, HOM uninjected embryos, and HOM embryos injected with human WT or P59L mutant MAFB mRNA. (B) Quantification of the ctsk expression in A. (C) WISH of ctsk expression at 3 dpf in HOM uninjected embryos, HOM embryos injected with human WT, P63R or S70L MAFB mRNA. (D) Quantification of the ctsk expression in C. (E) WISH of ctsk expression at 3 dpf in untreated and alendronate (AL)-treated embryos. (F) Quantification of the ctsk expression at 3 dpf in E. (G) Fluorescent images of Tg(ctsk:mGFP) at 5 dpf in WT and HOM embryos (the ventral view of head). (H) Mean grey value of fluorescence intensity of the images in G (n = 5 zebrafish per group). (I) AB staining of cartilages at 5 dpf in untreated and AL-treated embryos. Arrows indicate the lower jaw protrudes. (J) Quantification of AB staining in I. N = 50–100 embryos per group for A–F and I–J. WT, wild type; HET, mafbbd11/+; HOM, mafbbd11/d11; AL, alendronate. Results in B, D, F, J and H are expressed as mean ± SEM, (* p < 0.05, ** p < 0.01, *** p < 0.001, t test, ns, not significant). EXPRESSION / LABELING:
PHENOTYPE:
|