FIGURE SUMMARY
Title

Deciphering DSC2 arrhythmogenic cardiomyopathy electrical instability: From ion channels to ECG and tailored drug therapy

Authors
Moreau, A., Reisqs, J.B., Delanoe-Ayari, H., Pierre, M., Janin, A., Deliniere, A., Bessière, F., Meli, A.C., Charrabi, A., Lafont, E., Valla, C., Bauer, D., Morel, E., Gache, V., Millat, G., Nissan, X., Faucherre, A., Jopling, C., Richard, S., Mejat, A., Chevalier, P.
Source
Full text @ Clin Transl Med

ZFIN is incorporating published figure images and captions as part of an ongoing project. Figures from some publications have not yet been curated, or are not available for display because of copyright restrictions.

PHENOTYPE:
Fish:
Knockdown Reagent:
Observed In:
Stage: Protruding-mouth

ZFIN is incorporating published figure images and captions as part of an ongoing project. Figures from some publications have not yet been curated, or are not available for display because of copyright restrictions.

PHENOTYPE:
Fish:
Knockdown Reagent:
Observed In:
Stage: Protruding-mouth

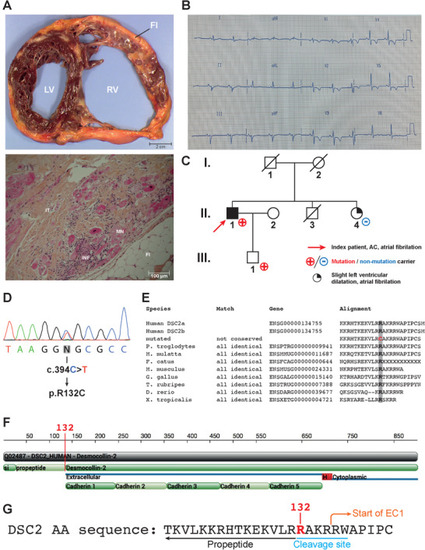
Clinical presentation. (A) Upper panel: transverse section of the ACM patient's explanted heart. The right ventricle (RV) is dilated. Adipo–fibrotic replacement of the myocardium is also observed. Lower panel: Microscopic section of the patient's explanted heart stained with hematoxylin, eosin and safran. Inflammation, adipose tissue and myocardial necrosis are observed. IT, interstitial tissue; INF, inflammation; FI, adipose tissue; MN, myocardial necrosis. (B) Twelve‐lead surface ECG illustrating the patient's electrical profile. The patient was in sinus rhythm with a PR interval at 160 ms, QRS interval at 120 ms and S wave slurring. Negative T waves were observed in V2 through V5. (C) Family pedigree. The index patient (II.1) is indicated by a red arrow. Individuals indicated with a red cross carry the mutation (II‐1 and III‐1). (D) Electropherogram of the patient's DNA showing the DSC2 mutation responsible for the R132C substitution. (E) Multispecies protein sequence alignment illustrating the high degree of conservation of the arginine at position 132 (highlighted in grey). (F) Two‐dimensional schematic of the DSC2 protein sequence showing the propeptide and cleavage site. Arginine 132 is located at the junction of the propeptide and the mature protein. (G) DSC2 protein sequence illustrating the location of arginine 132 within the cleavage site. Cleavage activates desmocollin's adhesive properties

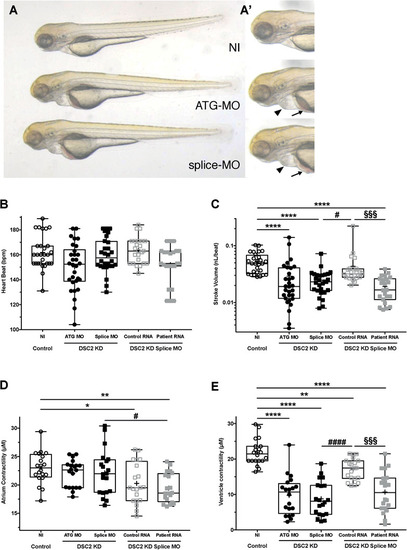
In vivo effect of DSC2 knockdown and mutation. (A) Bright‐field images of noninjected (NI), dsc2l ATG‐ and splice‐MO‐injected fish. (A') The same larvae at higher magnification. Both morphants display cardiac oedema (black arrowheads) and blood accumulation (black arrows). (B) Box plot depicting the average heart rate in beats per minute of non‐injected (NI, N = 28) and dsc2l ATG‐ (N = 30), splice‐morphant (N = 28) larvae and larvae co‐injected with dsc2l splice MO and human DSC2 wild‐type mRNA (N = 24) or mutated mRNA (N = 23). (C) Box plot depicting the average stroke volume in nanolitres per beat of non‐injected (NI, n = 28), dsc2l ATG‐ (N = 30), splice‐morphants (N = 28) and larvae co‐injected with dsc2l splice MO and human DSC2 wild‐type mRNA (N = 24) or mutated mRNA (N = 23). (D) Box plot depicting the average atrial contractile distance in micrometres (μm) of non‐injected (NI, N = 22) and dsc2l ATG‐ (N = 20) and splice‐morphants (N = 20), and larvae co‐injected with dsc2l splice‐MO and human DSC2 wild‐type mRNA (N = 20) or mutated mRNA (N = 20). (E) Box plot depicting the average ventricular contractile distance in micrometres (μm) of non‐injected (NI, N = 22), dsc2l ATG‐ (N = 20), splice‐morphants (N = 20) and larvae co‐injected with dsc2l splice‐MO and human DSC2 wild‐type mRNA (N = 20) or mutated mRNA (N = 20). *p < 0.05, **< 0.01, ***< 0.001, and ****p < 0.0001 (Kruskal–Wallis test). “*” indicates a value significantly different from that for the non‐injected, “#” indicates a value significantly different from that for the dsc2l splice‐MO, and “§” indicates a value significantly different from that for the larvae co‐injected with dsc2l splice‐MO and human DSC2 wild‐type mRNA

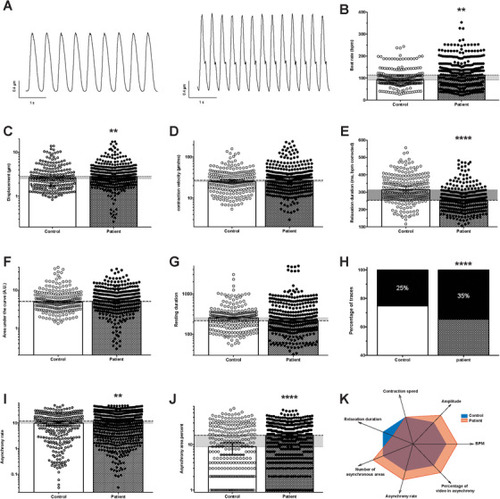
Evaluation of control and patient‐specific hiPSC‐CM spontaneous contractile function by video microscopy. (A) Contraction cycles from phase‐contrast videos of control (left) and patient‐specific (right) hiPSC‐CM monolayers obtained using custom made software analysis. (B–J) Contraction characteristics of control (N = 229) and patient‐specific monolayers (N = 359). (B) Beat rate, (C) cellular displacement, (D) contraction velocity, (E) contraction duration from peak to 90% relaxation corrected with Bazett's formula, (F) area under the curve, (G) resting duration, (H) the percentage of videos demonstrating aberrant contractile events (control: 25% (278 areas out of 1097 total areas); patient specific: 35% (600 areas out of 1727 total areas)), (I) the percentage of recording spent in asynchrony and (J) the percentage of the video area concerned by aberrant events. (K) Spider chart illustrating the main differences observed between control (blue area) and patient‐specific (orange area) hiPSC‐CM. A “normal” value of 2 is attributed to the control parameter. Each evaluated parameter is compared to the control condition and fixed as higher (3) or lower (1) if statistically significantly different. Histograms represent the median (95% confidence interval). The horizontal grey area illustrates the difference between the control and the patient specific conditions. **p < 0.01 and ****< 0.0001. Mann–Whitney test except for (H), Fisher's exact test

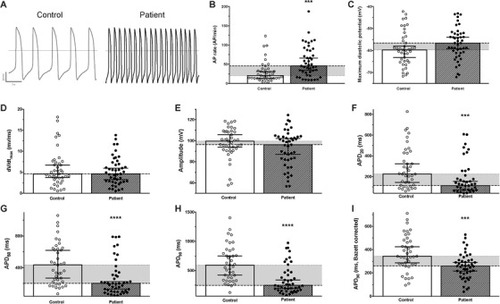
Spontaneous electrical activity of control and patient‐specific hiPSC‐CM. (A) Raw traces illustrating the recording of spontaneous electrical activity (action potentials, AP) of control (left) and patient‐specific (right) hiPSC‐CM. (BI) AP parameters were evaluated for both control (N = 41) and ACM patient‐specific (N = 45) hiPSC‐CM: (B) AP rate, (C) maximum diastolic potential, (D) maximum depolarization slope, (E) AP Amplitude, (F) AP duration at 20% of repolarization (APD20,), (G) APD50, (H) APD90 and (I) the APD90 corrected using Bazett's formula. Histograms represent the median (95% confidence interval). The horizontal grey area illustrates the difference between the control and the patient‐specific conditions. ***p < 0.001 and ****p < 0.0001 (Mann–Whitney test)

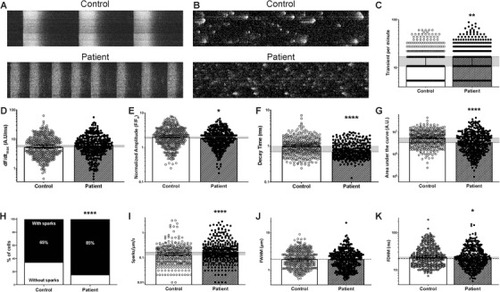
Spontaneous calcium dynamics of control and patient‐specific hiPSC‐CM. (A) Typical line‐scan confocal images (5000 lines, 1.24 ms/line, 1 × 512 pixels) of calcium transients in Fluo‐4 non‐ratiometric fluorescent probe‐loaded control (top) and patient‐specific (bottom) hiPSC‐CM. (B) The global transient activity was removed from the original image to keep only diastolic Ca2+ activity (sparks). (C–K). Both the Ca2+ transient activity (control N = 325 cells; patient N = 357 cells) and the sparks (control N = 362 cells; patient N = 373 cells) were studied: transient per minutes (C), maximum rising fluorescence slope (D), normalised amplitude (E), transient decay duration (F), area under the curve (G), the percentage of cells with Ca2+ sparks (control: 65% (362 out of 553); patient specific: 85% (373 out of 441)) (H), in each cell with sparks, their frequency (I), sparks full width at half maximum (J) and sparks full duration half maximum (K). Histograms represent the median (95% confidence interval). The horizontal grey area illustrates the difference between the control and the patient specific conditions. *p < 0.05 and ****p < 0.0001 (Mann–Whitney test, except for (H) where Fisher's exact test was used)

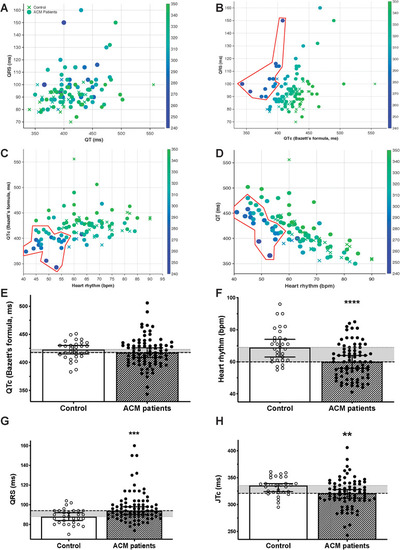
ECG parameters of an ACM cohort. ECG parameters and interdependence in a cohort of control (N = 30) versus ACM (N = 79) individuals, regardless of their age, genetic variation or treatments. (A–D) Control individuals are represented as crosses and ACM patients as circles. The symbols size (bigger symbols if JTc is longer) and colour both rely on the JTc duration (ms, colour scale indicated on the right of each plot). (A) The QRS duration is plotted as a function of the QT duration. (B) The QRS duration is plotted as a function of the QTc duration (Bazett's formula corrected). (C) The QTc duration (Bazett's formula corrected) is plotted as a function of the heart rate. (D) The QT duration is plotted as a function of the heart rate. (E–H) Recapitulative histograms depicting the control and ACM patient's ECG parameters: the QTc duration (Bazett's formula corrected) (E), the heart rhythm (F), the QRS duration (G) and the JTc duration (H). Histograms represent the median (95% confidence interval). The horizontal grey area illustrates the difference between the control and the patient parameters. *p < 0.05, **p < 0.01, and ****p < 0.0001 (Mann–Whitney test)

Acknowledgments
This image is the copyrighted work of the attributed author or publisher, and ZFIN has permission only to display this image to its users. Additional permissions should be obtained from the applicable author or publisher of the image. Full text @ Clin Transl Med