
- Title
-
Wnt16 Elicits a Protective Effect Against Fractures and Supports Bone Repair in Zebrafish
- Authors
- McGowan, L.M., Kague, E., Vorster, A., Newham, E., Cross, S., Hammond, C.L.
- Source
- Full text @ JBMR Plus
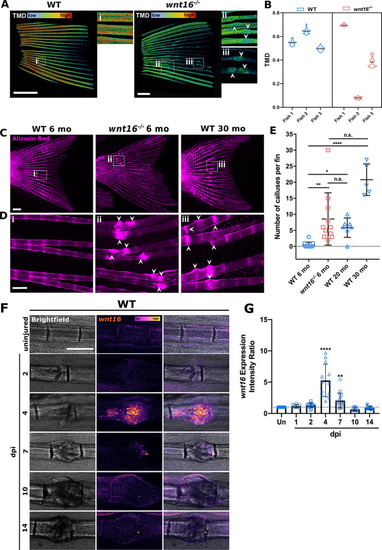
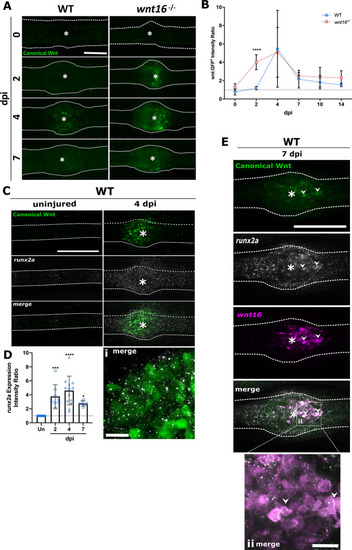
The |
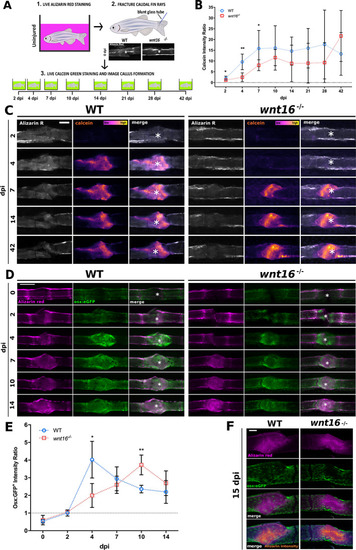
Bone mineralization and osteoblast recruitment is significantly delayed postfracture in |
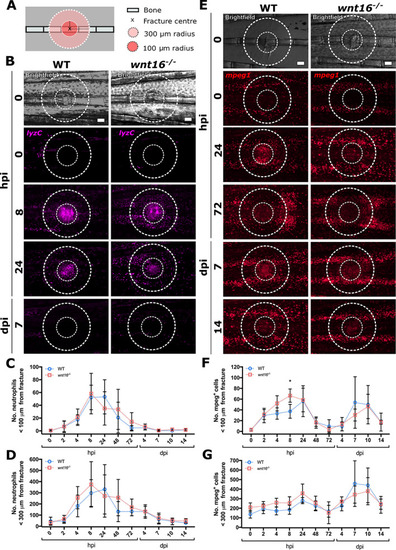
Loss of Wnt16 does not perturb leukocyte recruitment to bone postfracture. Fractures were induced in WT and |
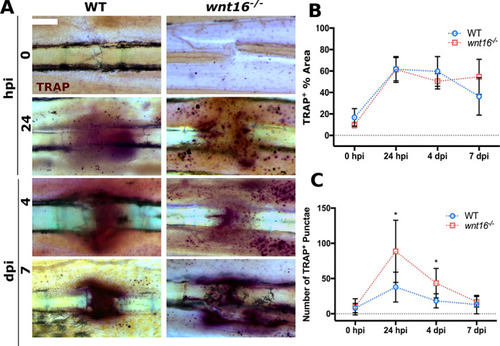
TRAP+ punctae accumulate near to fractures in PHENOTYPE:
|
The |

ZFIN is incorporating published figure images and captions as part of an ongoing project. Figures from some publications have not yet been curated, or are not available for display because of copyright restrictions. EXPRESSION / LABELING:
|