FIGURE SUMMARY
Title

A New Zebrafish Model for Pseudoxanthoma Elasticum

Authors
Czimer, D., Porok, K., Csete, D., Gyüre, Z., Lavró, V., Fülöp, K., Chen, Z., Gyergyák, H., Tusnády, G.E., Burgess, S.M., Mócsai, A., Váradi, A., Varga, M.
Source
Full text @ Front Cell Dev Biol

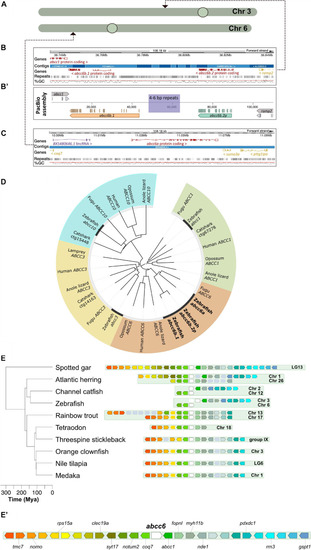
Annotation and phylogenetic relationships of the zebrafish ABCC6 orthologs. (A) Chromosomal positions of zebrafish ABCC6 orthologs. (B,B’) Ensembl (GRCz11) assembly of the respective chromosomal 3 regions with abcc6b.1 and abcc6b.2p and reassembly of this genomic region using PacBio reads. Note the abundance of repeats in the interval between abcc6b.1 and abcc6b.2p coinciding with the highly fragmented Ensembl assembly. (C) Ensembl (GRCz11) assembly of the abcc6a containing chromosomal six region. (D) Phylogenetic analysis of zebrafish ABCC1, ABCC3, ABCC6, and ABCC10 paralogs. (E,E’) Syntenic analysis of the abcc6 genomic region in different teleost species using the spotted gar genome as reference (see text for details).

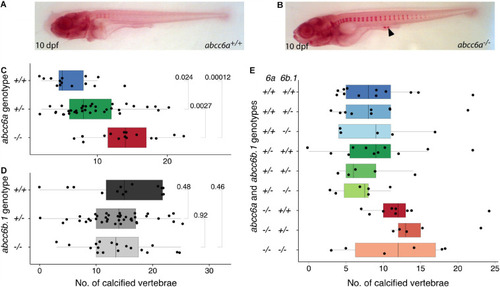
Calcification in single and double mutants of zebrafish ABCC6 paralogs. (A,B) Alizarin Red stained 10 dpf abcc6a+/+ and abcc6a–/– larvae. Ectopic calcification loci in mutants are denoted with arrowhead. (C) Quantification of calcified vertebrae in the 10 dpf progeny of abcc6a+/– carriers, plotted by genotype. The results show a significant increase in the rate of calcification in the abcc6 mutants compared to their siblings (n = 65, significance levels calculated with Mann-Whitney test). (D) Quantification of calcified vertebrae in the 14 dpf progeny of abcc6b.1+/– carriers, plotted by genotype. Results suggests that impairment of abcc6b.1 does not affect the rate of vertebral calcification (n = 72, significance levels calculated with Mann-Whitney test). (E) Quantification of calcified vertebrae in the 14 dpf progeny of abcc6a+/–;abcc6b.1+/– carriers, plotted by genotype (n = 68).

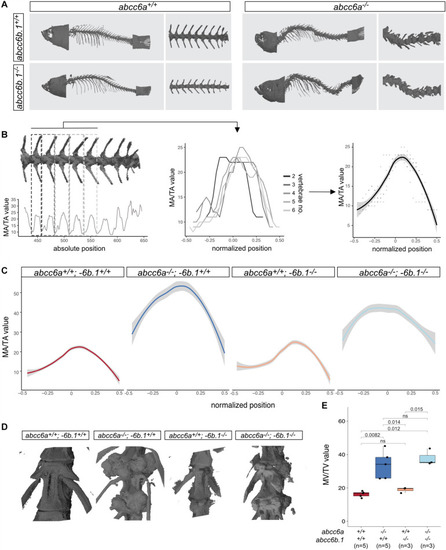
Effects of Abcc6-impairment of skeletal development and life-span. (A) Micro-CT pictures of whole fish and partial vertebral column with indicated genotypes. Abcc6a mutants (regardless of the abcc6b.1 genotype) show easily observable, gross skeletal deformities. (B) A graphical explanation of the method used to calculate normalized MA/TA plots for each genotype. Briefly, MA/TA values calculated for vertebraes 2–6 were averaged to create the normalized plots. (C) Normalized plots of MA/TA values for the indicated genotypes. The results also indicate an increase in the mineralization of the vertebrae of abcc6a–/– fish, while mutations in abcc6b.1 do not seem to affect this process. (D) 3D reconstruction micro-CT images of vertebrae in fish with the indicated genotypes. (E) MV/TV measurements for different genotypes. These results also demonstrate the effect of Abcc6a deficiency of the mineralization of skeletal vertebrae. Abcc6b.1 does not appear to be involved in the same process. (Significance levels calculated with t-test, ns = not significant).

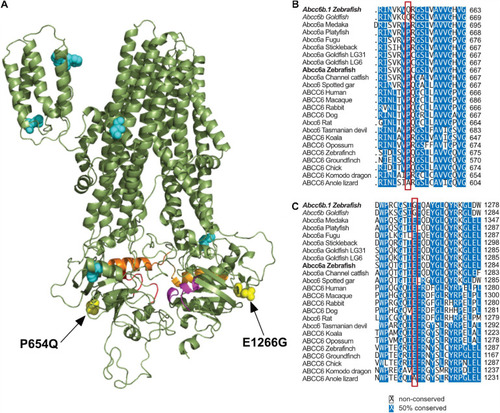
Significant differences in between Abcc6b.1 and canonical ABCC6 sequences. (A) Homology model of ABCC6, with conserved residues that are changed in Abcc6b.1 highlighted. (B) Alignment of multiple ABCC6 orthologs with the P654Q change highlighted by the red box. (C) Alignment of multiple ABCC6 orthologs with the E1266G change highlighted by the red box. These alignments show that P654 and E1266 are almost universally conserved across vertebrates, suggesting that they are important for the function of ABCC6. (Alignments of residues highlighted in cyan in A are detailed in Supplementary Figure 4).

Acknowledgments
This image is the copyrighted work of the attributed author or publisher, and ZFIN has permission only to display this image to its users. Additional permissions should be obtained from the applicable author or publisher of the image. Full text @ Front Cell Dev Biol