
- Title
-
In vivo proximity labeling identifies cardiomyocyte protein networks during zebrafish heart regeneration
- Authors
- Pronobis, M.I., Zheng, S., Singh, S.P., Goldman, J.A., Poss, K.D.
- Source
- Full text @ Elife
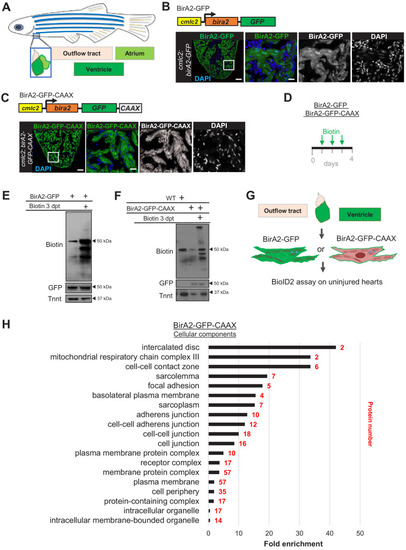
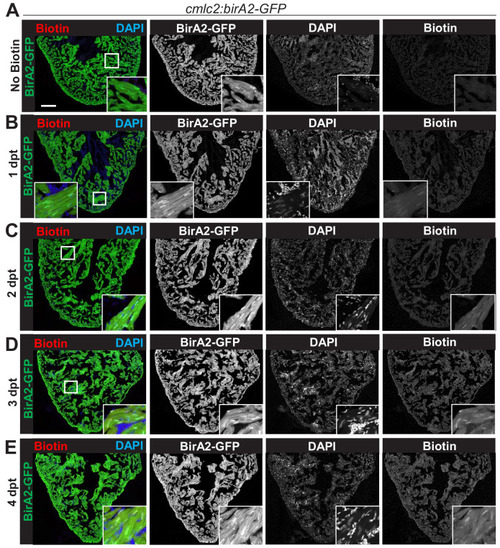
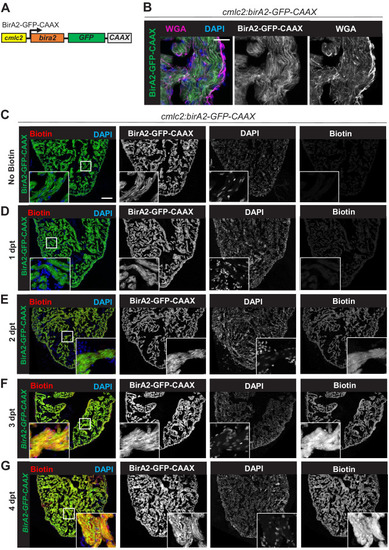
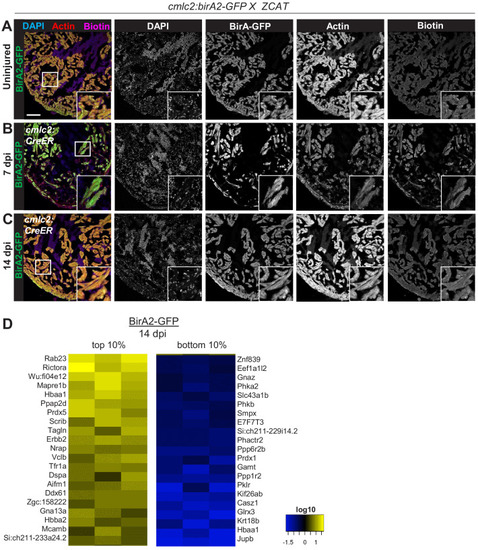
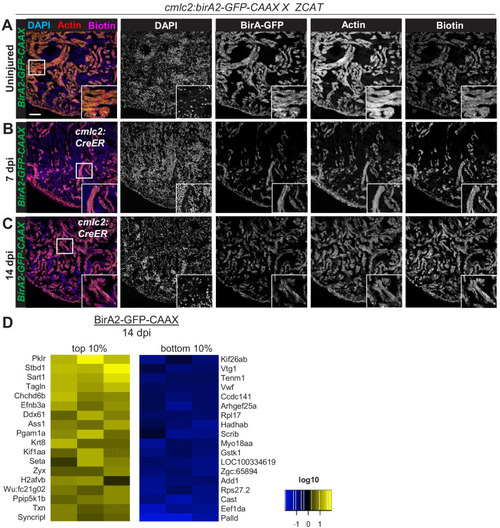
(A) Schematic representation of a zebrafish heart. The heart consists of a ventricle, atrium, and outflow tract. (B) BirA2-GFP is expressed in cardiomyocytes via the cmlc2 promoter. Section of ventricle from cmlc2:birA2-GFP transgenic animal. BirA2 is distributed throughout the cardiomyocytes, including the nucleus. DAPI staining and native GFP signal are shown. (C) BirA2-GFP-CAAX is expressed in cardiomyocytes via the cmlc2 promoter. Section of ventricle from cmlc2:bira2-GFP-CAAX transgenic animal. The CAAX-tag localizes BirA2 to the membranes of cardiomyocytes. (D) Timeline of biotin administration by intraperitoneal injections (IP injections). (E) Western blot analysis of biotinylation activity of BirA2-GFP-expressing ventricles. BirA2 is functional and biotinylates sufficiently after three daily biotin injections. Endogenous biotinylated carboxylase was detected in untreated and biotin-treated hearts. (F) Western blot analysis of BirA2-GFP-CAAX-expressing ventricles. BirA2 is functional and biotinylates sufficiently after three daily injections with biotin. WT: wild type. (G) Schematic summary of BioID2 assay on uninjured zebrafish hearts. (H) Over-representation test for cellular components. BioID2 for BirA-GFP-CAAX enriches for membrane-associated proteins. 343 total proteins were gated at a 2.5-fold change when normalized to BirA-GFP. p<0.001, false discovery rate (FDR) < 0.015%. dpt: days post treatment. Scale bar in images, 50 μm; magnification scale bar: 10 μm. |
( |
( |
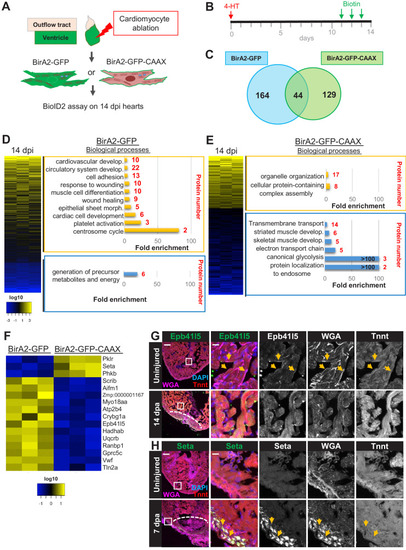
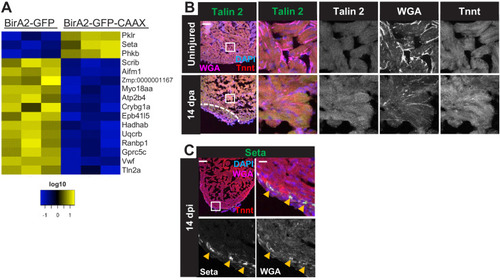
(A) Schematic overview of experimental workflow. cmlc2:birA2-GFP or cmlc2:bira2-GFP-CAAX ventricles were collected as uninjured samples or 14 days after induced cardiomyocyte ablation (dpi). (B) Timeline of injury and biotin injections. (C) Venn diagram comparing proteins captured by either the whole-cell BioID2 assay or the membrane BioID2 data set that display at least a 1.5-fold change. (D) Summary of BioID2 analysis of cmlc2:birA2-GFP hearts during regeneration. Left: heat map of proteins found in triplicates of quantitative mass spectrometry analysis. 208 proteins displayed a 1.5-fold change during regeneration when compared to uninjured hearts (p<0.05). Of these, most protein levels increase during heart regeneration. Protein level changes in log10 scale. Right: gene ontology analysis of BirA2-GFP BioID2 data set. Over-representation test of biological processes for at least 1.5-fold increased (yellow) and at least 1.5-fold decreased proteins (blue). Fold enrichment is shown, and protein number is indicated in red. p<0.001, FDR < 0.04%. (E) Summary of BioID2 on cmlc2:bira2-GFP-CAAX hearts. Left: heat map of proteins found in triplicates of quantitative mass spectrometry analysis. 173 proteins displayed an at least 1.5-fold change when compared to uninjured hearts (p<0.05). Of these, most proteins decreased at the membrane during heart regeneration. Right: gene ontology analysis of BirA2-GFP-CAAX BioID2 data set. p<0.001, FDR < 0.05%. (F) Heat map of proteins that have been identified in the BioID2 whole-cell and membrane data sets and that display opposing changes in levels. Those shown changed at least 1.5-fold, p<0.05. Heat map summarizes fold changes measured in three separate pooled samples. (G) Immunofluorescence against indicated proteins in ventricles. Epb41l5 is localized to the plasma membrane (marked by wheat germ agglutinin [WGA] staining) in uninjured hearts, with cytoplasmic fluorescence signals increasing during regeneration of resected tissue (14 days post amputation [dpa]). (H) Seta is poorly detected in uninjured hearts, rising 7 days after resection injury in the epicardium and compact layer of the heart. Seta localizes around the nucleus and colocalizes with the membrane marker WGA. Scale bar in images, 50 μm; magnification scale bar: 10 μm. |
( |
( |
( |
( |
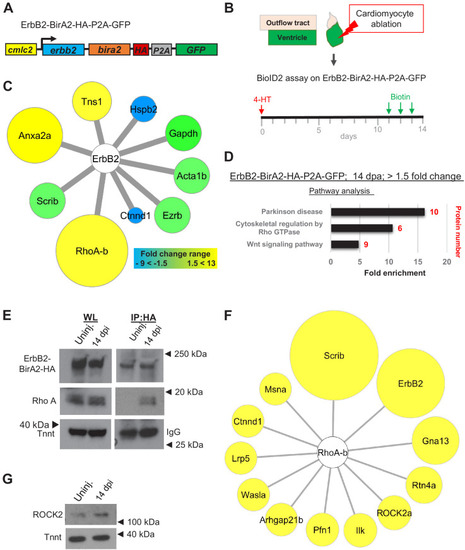
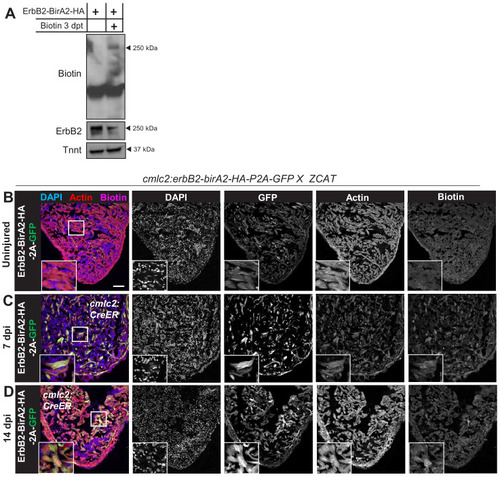
(A) ErbB2-BirA2-HA-P2A-GFP is expressed in cardiomyocytes via the cmlc2 promoter. (B) Summary of experiment and timeline. cmlc2:erbb2-birA2-HA-P2A-GFP ventricles were collected as uninjured samples or 14 days after induced cardiomyocyte ablation (dpi). (C) Known direct interactors of ErbB2 that were captured in the ErbB2 BioID2 assay. 108 proteins showed a change >1.5-fold when normalized to uninjured cmlc2:erbb2-birA2-HA-P2A-GFP ventricles. These data were analyzed for known ErbB2 interactors. Colors and size of interactor correspond to fold changes identified during regeneration. Green: no change; blue: levels decrease; yellow: levels increase. Tns1: tensin 1 (1.57-fold); Hspb2: heat shock protein beta 2 (−2.43-fold); Gapdh: glyceraldehyde 3-phosphate dehydrogenase (p>0.05); Acta1b: actin alpha 1 (p>0.05); Ezrb: ezrin b (p>0.05); Ctnnd1: catenin δ1 (−4.59-fold); RhoA-b: Rho A-b (13-fold); Scrib: scribble (p>0.05); Anxa2a: annexin A2a (7.31-fold). (D) Over-representation test – pathway analysis of proteins increased 1.5-fold or more in ErbB2-BirA data set. p<0.001, FDR < 0.005%. Fold enrichment is shown, and protein number in red. (E) Co-immunoprecipitation of ErbB2-BirA2-HA from uninjured or regenerating cmlc2:erbb2-birA2-HA-P2A-GFP hearts. Rho A association with ErbB2 is increased after injury. Anti-HA antibody was used for ErbB2 detection, and troponin T and IgG were used as loading controls. (F) Analysis of known Rho A interactors in BirA2-GFP BioID2 data set. All known direct interactors were found to be increased when normalized to uninjured hearts. Size of circles indicates fold change; proteins are sorted clockwise after fold change from high to low. Scrib: scribble (90.9-fold); ErbB2: Erb-b2 receptor tyrosine kinase 2 (52.9-fold); Gna13: guanine nucleotide binding protein alpha 13a (25.8-fold); Rtn4a: reticulon 4a (8.82-fold); ROCK2a: Rho-associated, coiled-coil containing protein kinase 2a (5.05-fold); Ilk: integrin-linked kinase (3.91-fold); Pfn1: profilin 1 (3.25-fold); Arhgap21b: Rho GTPase activating protein 21b (2.65-fold); Wasla: WASP-like actin nucleation promoting factor a (2.5-fold); Lrp5: low-density lipoprotein receptor-related protein 5 (2.21-fold); Ctnnd1: catenin δ1 (2.2-fold); Msna: moesin a (1.9-fold). (G) Western blot analysis of ROCK2 levels in uninjured and regenerating hearts. ROCK2 levels are increased during heart regeneration. |
( |
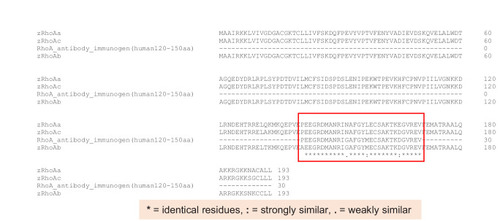
The Rho A antibody immunogen (human Rho A 120aa – 150aa) shows the highest conservation with Rho A-b. aa: amino acids. |
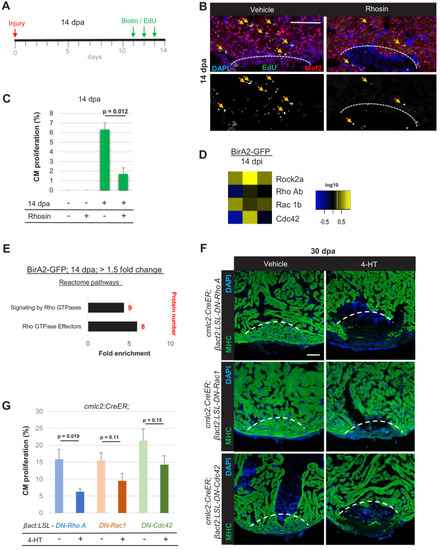
(A) Timeline of experiment for inhibiting Rho A function in 14 dpa hearts. (B) Immunofluorescence images of sections of 14 dpa ventricles vehicle or Rhosin treated and stained for EdU incorporation, an indicator of cardiomyocyte proliferation. Mef2 staining marks cardiomyocyte nuclei. Dashed line, approximate resection plane. Arrowheads, Mef2+/EdU+ cardiomyocytes. (C) Quantification of Mef2/EdU assays. Inhibition of Rho A by Rhosin reduces cardiomyocyte (CM) proliferation. n = 5 animals for each condition, two independent experiments. Data show mean ± SEM. (Mann–Whitney U test). (D) Heat map of indicated proteins from the whole-cell BioID2 data set. Of these, only levels of ROCK2a changed consistently (5.1-fold; p<0.05) during regeneration. (E) Over-representation test of reactome pathways. Signaling and effectors of Rho GTPases were found to be over-represented. Fold enrichment as indicated, and protein number in red. p<0.001, FDR < 0.02%. (F) Myosin heavy chain (MHC) (green) staining ventricles from animals with induced myocardial-specific dominant-negative Rac, Rho, or Cdc42, along with vehicle-treated ventricles, at 30 dpa. Five to eight animals were assessed in each group treated with vehicle, with none of these animals displaying regeneration defects. Four of five ventricles with induced dominant-negative Rac1, and all ventricles with induced dominant-negative Rho A (n = 7/7), or Cdc42 (n = 9/9), showed obvious areas of missing myocardium. Fisher–Irwin exact test, p<0.05. Dashed line, approximate resection plane. Scale bars, 50 µm. (G) Quantification of cardiomyocyte proliferation by Mef2/Proliferating cell nuclear antigen (PCNA) staining of n = 4 animals for each condition. Data show mean ± SEM. (Mann–Whitney U test). |

( |
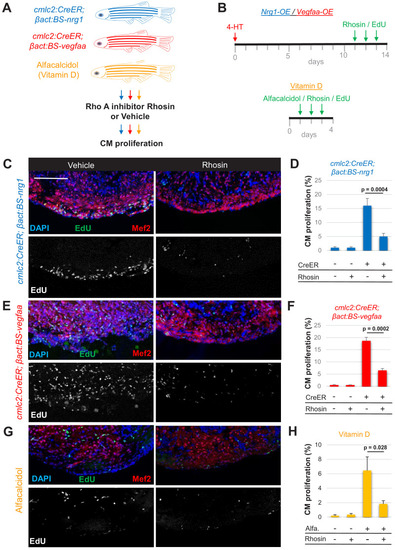
(A) Summary of transgenic animals used in Rho A inhibition experiments. (B) Timeline of experiments for Nrg1-overexpression (OE, blue), Vegfaa-OE (red), and alfacalcidol treatment (orange). (C, E, G) Immunofluorescence images of ventricles stained for Mef2/EdU from animals overexpressing Nrg1 (C) or Vegfaa (E) in cardiomyocytes, or injected with alfacalcidol (G). Hearts were treated with either vehicle or Rhosin. Scale bar, 50 μm. (D, F, H) Inhibition of Rho A by Rhosin reduces cardiomyocyte (CM) proliferation. Quantification of Mef2/EdU staining. Five to six animals were assessed for each group in two independent experiments. Data show mean ± SEM (Mann–Whitney U test). |
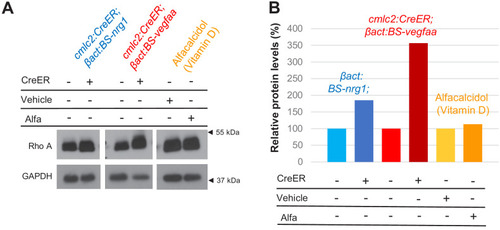
(A) Western blot analysis of Rho A levels in ventricles of zebrafish with Nrg1-overexpression (OE), Vegfaa-OE, or vitamin D receptor activation via alfacalcidol. (B) Quantification of western blot shown in (A). In untreated hearts, Rho A levels were set to 100%. Levels were normalized to loading control GAPDH. |