
- Title
-
Injury-induced Cavl-expressing cells at lesion rostral side play major roles in spinal cord regeneration
- Authors
- Zeng, C.W., Kamei, Y., Shigenobu, S., Sheu, J.C., Tsai, H.J.
- Source
- Full text @ Open Biol.
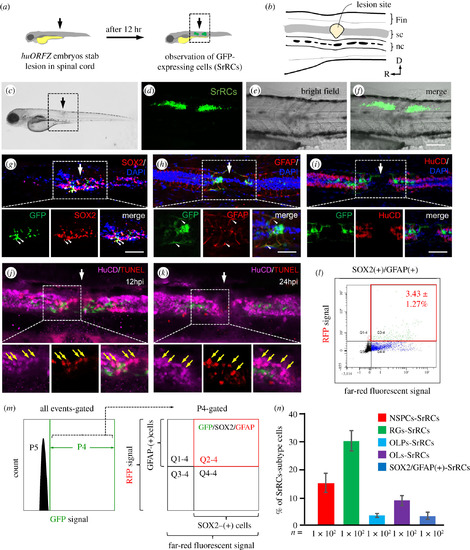
A specific subtype-cell population found in spinal cord of zebrafish larvae following SCI was identified. (a) Schematic diagram of the experiments following SCI. Arrow indicates the spinal cord (sc) injury site. (b) The enlarged image of SCI site shown in the box in (a). nc: notochord. (c) Zebrafish embryos from transgenic line huORFZ at 72 hours-post-fertilization (hpf) were treated with SCI, as indicated by the arrow. Enlarged image of the box area indicated in (c) was observed under microscopy: (d) fluorescence, (e) bright-field and (f) merged images, in which GFP-expressing cells (SrRCs) were apparent on both sides of the SCI site at 12 h post-injury. Scale bar indicates 50 µm. (g–i) Immunostaining identified cell types among the subtype cell population of SrRCs. White arrow indicates the location of SCI site. Red fluorescence was specifically labelled as (g) SOX2, (h) GFAP and (i) HuCD. Yellow fluorescence signal indicated that GFP-expressing SrRCs overlapped target protein labelled by red fluorescence signal, as indicated by yellow arrows. Scale bar indicates 15 µm. (j,k) TUNEL assay identified apoptotic cells by red fluorescence signal. Neurons were identified by marker HuCD labelled with far-red fluorescence signal. The apoptotic neurons appeared in pink colour. (l,m) After FACS, the isolated SrRCs were immunostained with antibodies against SOX2 and GFAP (P5: background; P4: cells expressing GFP signal; Q2–4: GFP(+) cells co-expressing SOX2-infrared light signal and GFAP-RFP signal). (n) Calculating the ratio of each cell type among GFP-expressing cell populations isolated by FACS. Error bars indicate s.e.m. |
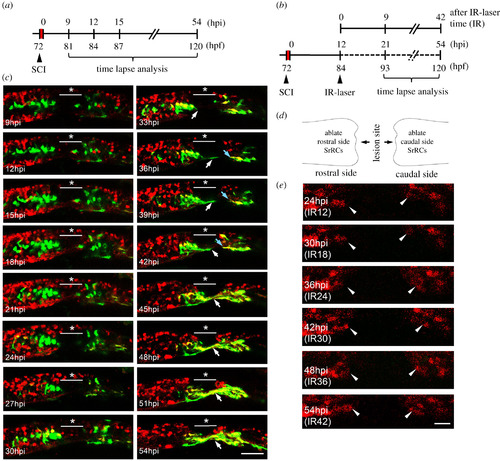
Using an in vivo system to confirm that SCI-induced SrRCs played a role in neuronal regeneration. (a) Schematic diagram of the timetable designed for observing the neuronal regeneration of SCI-larva. hpi: hours-post-injury; hpf: hours-post-fertilization. (b) Schematic diagram of the time table designed for observing the neuronal regeneration of SCI-larvae after infrared (IR)-LEGO laser (IR) treatment which was used to ablate their GFP-expressing cells. (c) Double-transgenic embryos derived from line Tg(huc-DsRed), crossed with line huORFZ, were used to dynamically trace neural differentiation and regeneration following SCI by confocal time-lapse photography. The underscored stars indicate the location where SCI was performed, while white arrows point to cells differentiated into neurons and their extended axons at the series time point indicated. (d) Diagram illustrated that SrRCs located at both sides (rostral and caudal) of SCI site were ablated. (e) Tracing neuronal differentiation and regeneration at series time point, as indicated, after both sides of SrRCs of SCI-larvae were ablated simultaneously. Photos were taken from lateral view in which dorsal side was upward, while rostral side was at left. Arrowheads indicate outgrowing neurites. Scale bar at right bottom was presented as 10 µm. |
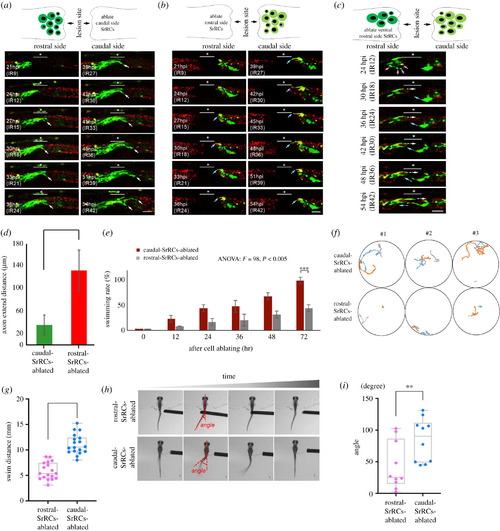
Rostral-SrRCs in the spinal cord of SCI-treated zebrafish larvae can prominently enhance functional recovery during neuronal regeneration. Double-transgenic embryos derived from transgenic line Tg(huc-dsRed), crossed with line huORFZ, were used to trace neural differentiation and regeneration following SCI by confocal time-lapse photography. (a–c) The underscore stars indicate the SCI sites, while white arrows point to cells differentiated into neurons and their extended axons. Dynamic traces of neural differentiation and regeneration of SCI-treated larvae upon termination of IR-Laser ablation (IR) for serial hours, as indicated, when (a) caudal-SrRCs, (b) rostral-SrRCs and (c) rostral-SrRCs on the ventral side were ablated. (d) Statistical analysis of the average of the axonal extended distance (μm) obtained from 10 larvae in each group after IR-laser ablation of caudal- or rostral-SrRCs of SCI-larvae. Unpaired t-test was used to perform statistical analysis of significant difference between two groups (***p < 0.001). (e) Statistical analysis of swimming recovery rates of SCI-treated larvae upon termination of IR-Laser treatment at IR0 (starting time) through IR72 (t-test: ***p < 0.001). (f) Using a high-speed camera system to capture the swimming route of SrRCs-ablated SCI-larvae at IR72. Numbers #1, #2 and #3 indicate three individuals out of six larvae in each group. Each one was recorded three times (as also referenced in electronic supplementary material, figure S7). (g) Comparison of swimming distance of larvae between two groups. Swimming distance (mm) was represented as overall mean for each group calculated from the total mean of 18 larvae. The average value for each larva was based on three independent trials. (Two-way ANOVA with Bonferroni multiple comparisons test, ***p < 0.005; t-test: ***p < 0.001). (h) After touch-evoked response, photos were taken to calculate C-band angle, which was the angle between the centre of gravity and the tail. (i) Statistical analysis of the overall average of the C-bend degrees calculated from 10 larvae in each group. Unpaired t-test showed that degree was significantly different between these two groups (**p < 0.01). Error bars indicate s.e.m. |
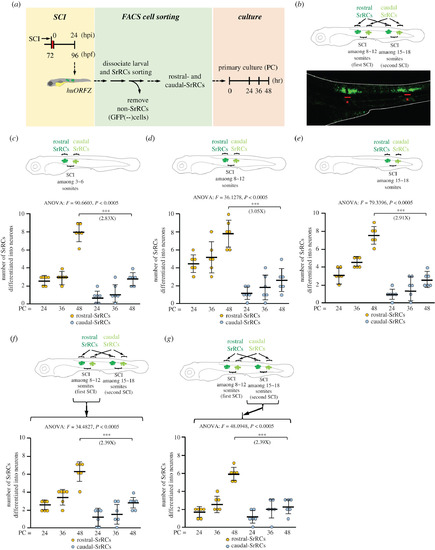
Assessment of neuronal differentiation capability showed that rostral-SrRCs achieved a higher fold increase than caudal-SrRCs during neuronal regeneration following SCI. (a) Schematic diagram illustrating the experimental design. (b) SCI was performed twice simultaneously at 8–12 and 15–18 somites. As demonstrated in the lower panel, a cluster of GFP-expressing SrRCs appeared at both sides of each SCI site, as observed under confocal microscopy. Stars combined with underscore indicate SCI sites. (c–e) Illustration of experimental design by performing single SCI at (c) 3–6, (d) 8–12 and (e) 15–18 somites. The numbers of collected rostral- and caudal-SrRCs able to differentiate into neurons after culturing were calculated separately, and the cell numbers after 48 h culture were compared by the increase in fold. (f,g) Illustration of experimental design by performing SCI simultaneously at 8–12 (the first SCI) and 15–18 somites (the second SCI). The numbers of collected rostral- and caudal-SrRCs from (f) the first 8–12 somite-SCI and (g) the second 15–18 somite-SCI sites able to differentiate into neurons after culturing were calculated separately, and cell numbers after 48 h culture were compared by the increase in fold. Two-way ANOVA with Bonferroni multiple comparisons test, ***p < 0.005; t-test: ***p < 0.001; each F value was also indicated. Error bars indicate s.e.m. |
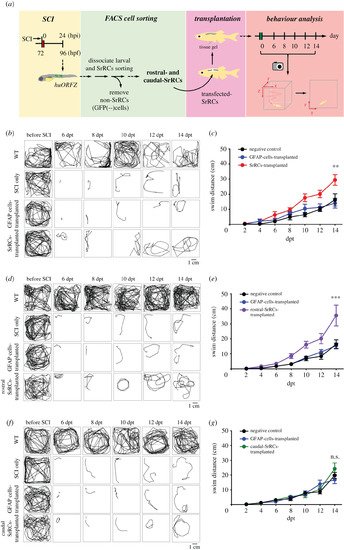
Unlike transplanted caudal-SrRCs, transplantation of rostral-SrRCs could significantly improve neuronal regeneration of SCI-adult zebrafish. (a) Schematic diagram illustrating the effect of SrRCs transplantation on neuronal regeneration of SCI-adult fish. SCI was performed on huORFZ embryos at 72 hpf (hours-post-fertilization). (b–g) The locomotive route of each fish was tracked in line, and its swimming distance (cm) was calculated. The results obtained from non-treated WT (WT; positive control), SCI-treated zebrafish (SCI-only; negative control) and GFAP-cell transplantation (sham control) were compared to (b,c) SrRCs transplantation, (d,e) rostral-SrRCs transplantation and (f,g) caudal-SrRCs transplantation. Two-way ANOVA with Bonferroni multiple comparisons test (***p < 0.01, **p < 0.1; n = 10). Error bars indicate s.e.m. dpt: days post-transplantation; ns: not significant. |
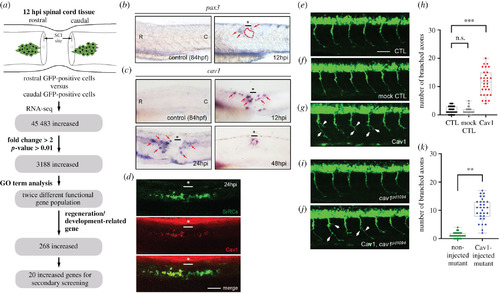
Expression of cav1 transcript and encoded protein in zebrafish embryos. (a) Schematic illustration showing how putative genes were selected for this study. Using whole-mount in situ hybridization to detect (b) pax3 and (c) cav1 mRNAs in the spinal cord of zebrafish embryos before SCI (served as a negative control) and after SCI at 12, 24 and 48 h post-injury (hpi), as indicated. Since the expression pattern of pax3a, another transcript screened from RNA-seq, also showed increased expression in rostral-SrRCs compared to that in caudal-SrRCs, it served as a positive control in a parallel experiment. (d) Using IHC detection to examine the protein level of Cav1 (labelled by red signal) expressed in SrRCs (labelled by green signal), including rostral-SrRCs and caudal-SrRCs, in SCI-embryos at 24 hpi. The underscore stars indicate the SCI sites. Scale bar shown at lower right corner is 50 μm. (e) CaP motor neuron labelled by GFP was observed in the spinal cord of zebrafish embryos from transgenic line Tg(mnx:GFP) at 24 hpf (un-injected control. Student's t-test was used to perform statistical analysis, **p < 0.01 significance. CTL), (f) pCS2-vector-injected embryos (mock control) and (g) pCS2-Cav1-injected embryos. (h) Quantification and comparison of the number of branched axons of CaP motor neurons between groups. (i) GFP-labelled CaP motor neurons observed in the spinal cord of embryos from cav1 mutant (cav1pd1094) at 24 hpf (un-injected control). Student's t-test was used to perform statistical analysis, **p < 0.01 significance. (j) pCS2-Cav1-injected embryos from a double-transgenic line, in which mutant cav1pd1094 was crossed with Tg(mnx:GFP). White arrows indicate branched axons. (k) Quantification and comparison of the number of branched axons of CaP motor neurons between groups as indicated. Each spot indicates the number of axonal branches in each embryo (n = 30), in which six CaP motor neurons were analysed. Student's t-test was used to perform statistical analysis, ***p < 0.001 significance. |
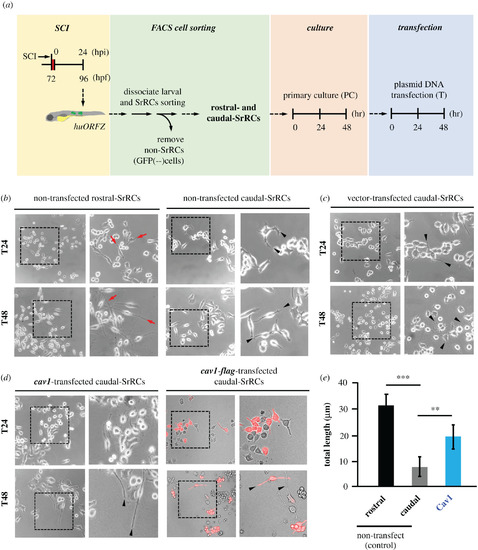
Overexpression of cav1 could drive caudal-SrRCs to extend longer axonal neurites in vivo. Rostral- and caudal-SrRCs were separately collected from SCI-embryos, and primary culture (PC) was carried out for 48 h. Afterwards, plasmid containing cav1 cDNA was transfected into caudal-SrRCs. Neurites developed from cultured SrRCs after plasmid was transfected for 24 h (T24) and 48 h (T48) were morphologically examined: (a) non-transfected rostral-SrRCs, (b) non-transfected caudal-SrRCs, (c) caudal-SrRCs transfected with pCS2-vector and (d) caudal-SrRCs transfected with pCS2 containing cav1 and cav1-flag cDNA. Right panel of each figure shows the amplified image of the box area indicated on left panel. Arrowheads indicate the extended axons. (e) The average neurite length developed from SrRCs cultured for 48 h after transfection was calculated from 200 cultured SrRCs. Statistical analysis was based on t-test at **p < 0.01 and ***p < 0.001 significance. |
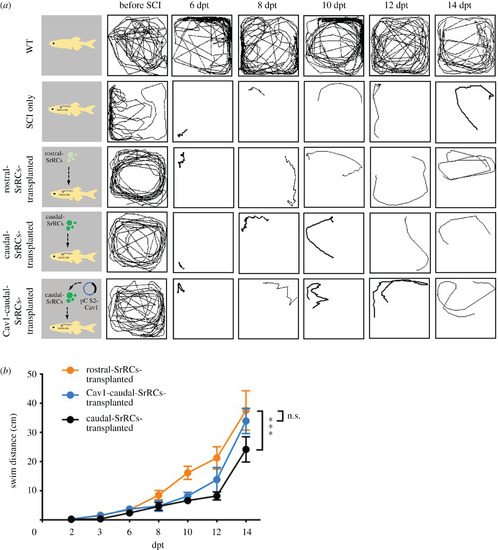
Transplantation of Cav1-transfected caudal-SrRCs improved neuronal regeneration of adult zebrafish post-SCI. Locomotion test of SCI-adult fish during neuronal regeneration from 6 days post-transplantation (dpt) to 14 dpt. (a) The locomotive route of each fish was tracked in line, (b) its swimming distance (cm) was calculated, and the results were compared among non-treated WT-adult (WT; positive control), SCI-adult (SCI-only; negative control), rostral-SrRCs-transplanted SCI-adult, caudal-SrRCs-transplanted SCI-adult and Cav1-caudal-SrRCs-transplanted SCI-adult in which SCI adults were transplanted with caudal-SrRCs transfected by cav1. Two-way ANOVA and t-test were used to perform statistical analysis with different significance level at ***p < 0.001, **p < 0.05, *p < 0.01; error bars indicate s.e.m. |
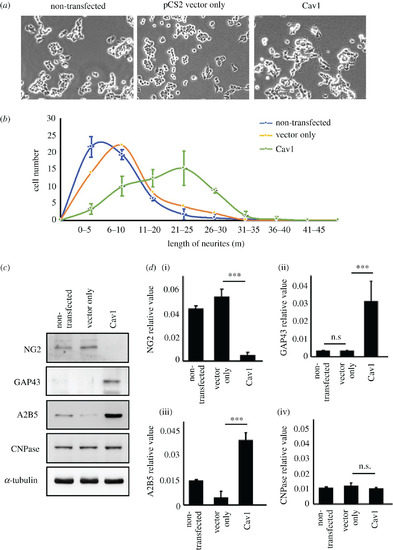
Overexpression of cav1 in motor neuron cells can promote neurite outgrowth and expression of functional neuron markers. NSC34 motor neuron cells were employed to examine the effect of Cav1 on neurite outgrowth. NSC34 cells were grouped into three treatments: non-transfected (control group), transfected with pCS2-vector (pCS2-vector only group) and transfected with pCS containing cav1 cDNA (pCS2-cav1 group). (a) Neurite outgrowth of motoneurons developed from 48 h-cultured NSC34 cells overexpressing cav1 (pCS2-cav1 group) was observed under microscopy. (b) The size distribution of neurite length developed from NSC34 cells transfected with materials as indicated. Cell number with various lengths of neurites after culturing for 48 h was determined (50 cells per experimental condition). (c) Western blot analysis using antibody against neuron markers as indicated. Three independent experiments were performed. The α-tubulin served internal loading control. (d) Relative expression level of each marker was quantified. Statistical analysis used t-test with different significance levels at ***p < 0.001, **p < 0.05, *p < 0.01; error bars indicate s.e.m. n.s.: not significant. |
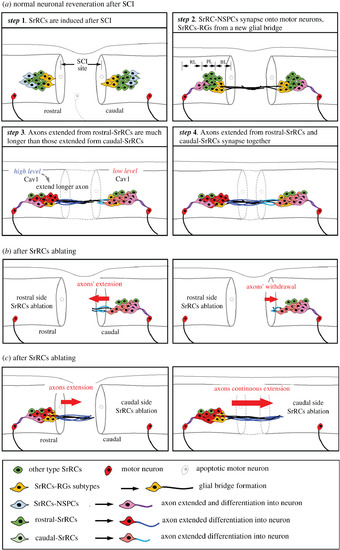
Schematic illustration showing the contribution of SrRC subtypes to neuronal regeneration after SCI in zebrafish. (a) Several steps of normal neuronal regeneration. (b) Ablation of rostral-SrRCs attenuates the elongation of caudal-SrRCs axons, effectively aborting neuronal repair. (c) Ablation of caudal-SrRCs has little effect on axons derived from rostral-SrRCs, which continue to develop and perform neuronal repair. |