
- Title
-
Knockout of myoc Provides Evidence for the Role of Myocilin in Zebrafish Sex Determination Associated with Wnt Signalling Downregulation
- Authors
- Atienzar-Aroca, R., Aroca-Aguilar, J.D., Alexandre-Moreno, S., Ferre-Fernández, J.J., Bonet-Fernández, J.M., Cabañero-Varela, M.J., Escribano, J.
- Source
- Full text @ Biology (Basel)
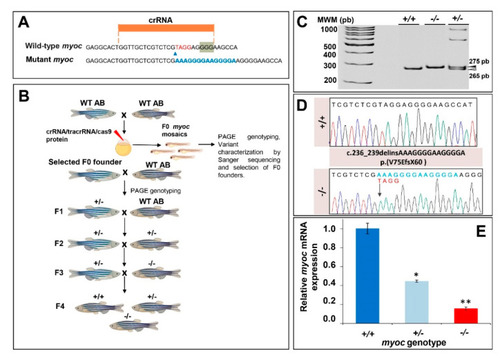
Generation and molecular characterisation of a myoc KO zebrafish line using CRISPR/Cas9 genome editing. (A) Localisation of the crRNA designed to target myoc exon 1. The PAM sequence is indicated on a green background. Red and blue nucleotides indicate deleted and inserted nucleotides identified in mutant fishes used to establish the KO line, respectively. (B) Stepwise procedure that was followed to establish the KO line. F0 animals were raised to adulthood, crossed with wild-type AB zebrafish and the offspring was genotyped by PAGE to identify germline transmission of myoc deletions (F0 founders). F0 founders were crossed with wild-type AB animals to obtain mutant F1 heterozygotes that were further outbred to segregate off-targets mutations and to obtain the F2 generation. F2 heterozygotes were inbred to produce the F3 generaton. The Biorender tool was used to create this scheme. (C) Genotyping of a myoc indel using 8% PAGE. Three representative samples are shown. White arrowhead: wild-type allele (265 bp). Black arrowhead: mutant allele (275 bp). (D) Sanger sequencing of the selected myoc mutation. The arrow in the electropherogram indicate the nucleotide where the mutation starts. Blue and red letters indicate inserted (14 bp) and deleted (4 bp) nucleotides, respectively. (E) Decreased myoc mRNA levels in myoc mutant zebrafish (+/− and −/−). mRNA levels in pools of 15 F3 zebrafish larvae (144 hpf) were measured by qRT-PCR. The results are expressed as relative expression levels and normalised to control wild-type (+/+) larvae. Values represent the average of three different experiments. Asterisks indicate statistical significance compared to +/+. * p = 00051. ** p =0.00017. |
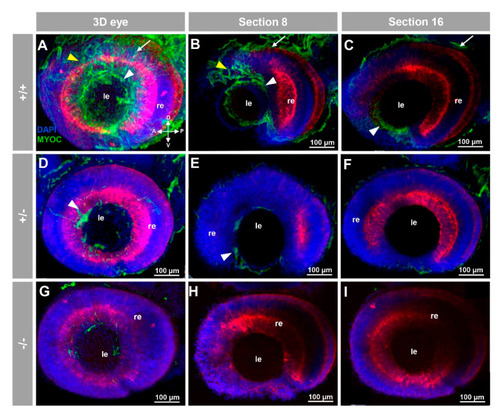
Fluorescent whole-mount immunohistochemical detection of myocilin in the eye of zebrafish embryos (96hpf). Wild-type (A–C), heterozygous (D–F) and homozygous (G–I) myoc mutant embryos were incubated with a chicken conjugated goat anti-chicken IgY secondary antibody. Three-dimensional reconstruction from z-stack scanned confocal microscopy images (A,D,G) of the eye. Optical sections (92 μm) 8 (B,E,H) and 16 (C,F,I), from the exterior ocular surface, were selected from z-stack images to show the precise localisation of the green signal in the external and internal surface of the optic cup (white arrows and yellow arrowheads, respectively), lens epithelium (white arrowhead), and dorsoposterior and ventral periocular tissues (yellow arrowheads) (A–C). Blue: DAPI nuclear staining. Green: Cy2-conjugated goat anti-chicken IgY secondary antibody. Red: tissue autofluorescence. The cross indicates the position of the embryonic axes (D: dorsal; P: posterior; V: ventral; A: anterior). The images are representative of the result observed in 10 embryos. le: lens. re: retina. The negative controls are shown in Figure S3A–C. Two-dimensional confocal image z-stacks are shown in Supplementary Video S1. |
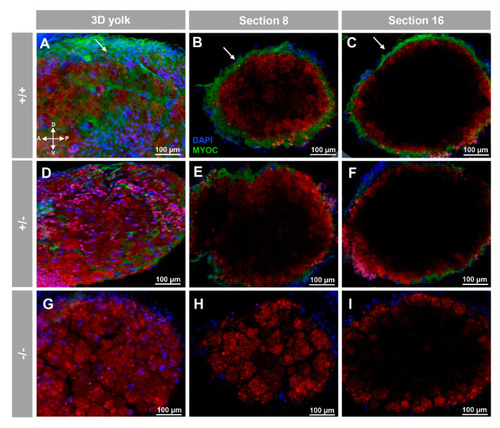
Fluorescent whole-mount immunohistochemical detection of myoc in the yolk of zebrafish larvae (96hpf). Wild-type (A–C), heterozygous (D–F) and homozygous (G–I) myoc mutant embryos were incubated with chicken anti-myocilin (TNT) primary antibody and a Cy2-conjugated goat anti-chicken IgY secondary antibody. Three-dimensional reconstruction from z-stack scanned confocal microscopy images (A,D,G) of the yolk. Sections (92 μm) 8 (B,E,H) and 16 (C,F,I), were selected from z-stack images to show the precise localisation of the green signal on the yolk’s surface (arrows) (A–C). Blue: DAPI nuclear staining. Green: Cy2-conjugated goat anti-chicken IgY secondary antibody. Red: tissue autofluorescence. The cross indicates the position of the embryonic axes (D: dorsal; P: posterior; V: ventral; A: anterior). The images are representative of the result observed in 10 embryos. The negative controls are shown in Figure S3D–F. Two-dimensional confocal image z-stacks are show in Supplementary Video S2. |
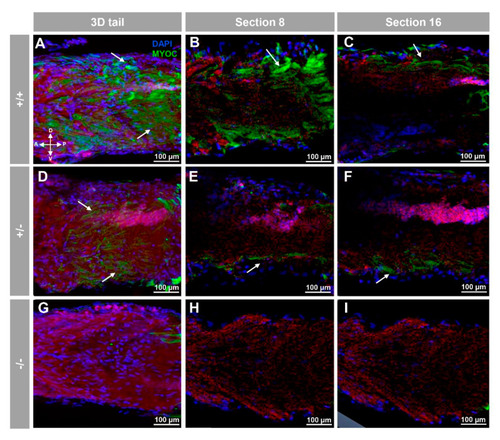
Fluorescent whole-mount immunohistochemical detection of myoc in the tail of zebrafish embryos (96hpf). Wild-type (A–C), heterozygous (D–F) and homozygous (G–I) myoc mutant embryos were incubated with a chicken anti-myocilin (TNT) primary antibody and a Cy2-conjugated goat anti-chicken IgY secondary antibody. Three-dimensional reconstruction from z-stack scanned confocal microscopy images (A,D,G) of the tail. Sections (92 μm) 8 (B,E,H) and 16 (C,F,I) were selected from z-stack images to show the precise localisation of the green signal in the tail’s skin (arrow) (A–C). Blue: DAPI nuclear staining. Green: Cy2-conjugated goat anti-chicken IgY secondary antibody. Red: tissue autofluorescence. The cross indicates the position of the embryonic axes (D: dorsal; P: posterior; V: ventral; A: anterior). The images are representative of the results observed in ten embryos. The negative controls are shown in Figure S3G–I. |
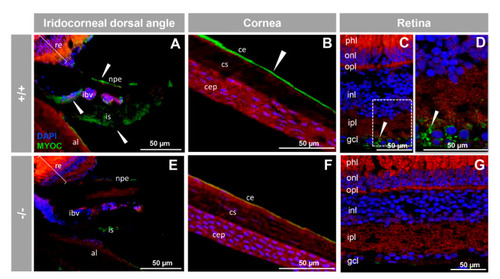
Immunohistochemistry of myocilin in ocular structures of adult zebrafish. Fluorescent immunohistochemistry of iridocorneal dorsal angle (A,E), cornea (B,F) and retina (C,D,G) sections (14 μm) of wild-type and KO myoc adult zebrafish (7 months). Samples were incubated with an anti-myocilin primary antibody (TNT), followed by Cy2-conjugate goat anti-chicken IgY secondary antibody (green signals). The TNT antibody recognises the N-terminal part of myocilin protein. Expression is seen in the non-pigmented epithelium of the ciliary body and in the iris stroma and iris vessels (A), in the corneal endothelium (B), and in the ganglion cell layer in the retina (C,D) (arrowhead) in wild-type. Red signals correspond to tissue autofluorescence and blue signals correspond to DAPI nuclear staining. al: annular ligament. npe: non-pigmented ciliary epithelium; ibv: iris blood vessels; is: iris stroma. cep: corneal epithelium; cs: corneal stroma; ce: corneal endothelium glc: ganglion cell layer; ipl: inner plexiform layer; inl; inner nuclear layer; opl: outer plexiform layer; onl: outer nuclear layer; phl: photoreceptor layer. re: retina+/+: wild-type; −/−: myoc KO. The negative controls are shown in Figure S4. |
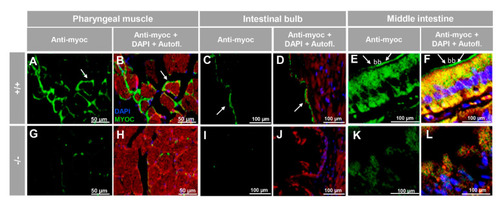
Immunohistochemistry of myocilin in non-ocular tissues of adult zebrafish. Wild-type and myoc KO adult (7 months) zebrafish tissue sections (14 μm) were incubated with a chicken anti-myocilin (TNT) primary antibody and a Cy2-conjugate goat anti-chicken IgY secondary antibody. Arrows show immunostaining in the periphery of pharyngeal muscular fibres (A,B,G,H), the enterocyte apical side in the intestinal bulb (C,D,I,J) and in the brush border of the epithelial cells in the middle intestine (E,F,K,L). Red signals correspond to tissue autofluorescence. bb: brush border. The images are representative of the results observed in three tissue sections from three animals. +/+: wild-type; −/−: myoc KO. Negative controls are shown in Figure S5. |
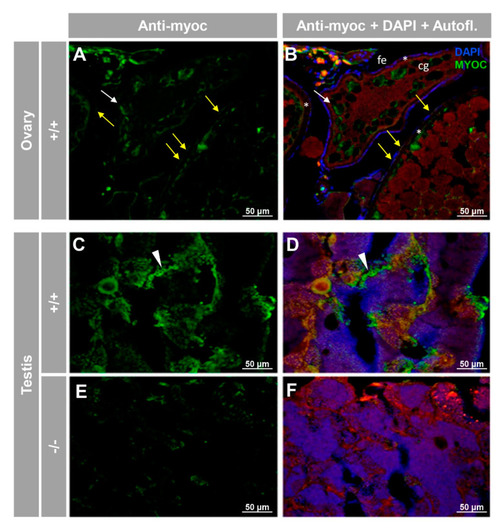
Immunohistochemical detection of myoc in the reproductive system of adult zebrafish. Tissue sections (14 μm) of adult (7 months) wild-type ovary ( |
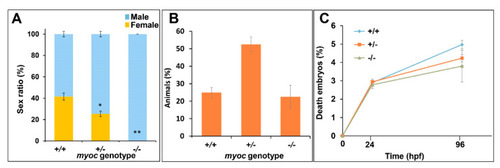
Absence of females among myoc KO zebrafish. Eight +/− myoc siblings were mated, and 30–35 embryos per cross were randomly selected (n = 256), raised to adulthood and genotyped by PAGE. The sex ratio as a function of the myoc genotype was calculated (A). Observed genotype proportions (B) and embryo survival (C). Values are expressed as the mean ± standard error of the mean (SEM). Asterisks indicate statistical significance compared to +/+. * p = 0.00038. ** p = 0.00001. +/+: wild-type; −/−: myoc KO. PHENOTYPE:
|
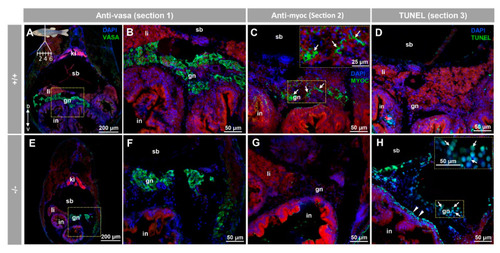
Myocilin expression and apoptosis analysis in the immature (28 dpf) gonad of zebrafish KO for myoc. Analyses were performed on three consecutive tissue sections (1 to 3, upper left insert in panel A). Vasa immunolabeling was carried out on section one (green, A,B,E,F). Areas indicated by yellow rectangles in (A,E) are magnified in (B,F), respectively. Tissue section two was incubated with an anti-myocilin (TNT) antibody (green signals) to localise myocilin expression (C,G). Apoptosis was assessed in tissue section three using terminal dUTP nick-end labeling (TUNEL) of fragmented DNA (D,H). Arrows in (C) indicate myocilin immunoreactivity. Arrows and arrowheads in H indicate TUNEL-positive cells in gonadal tissue and in the outer intestinal wall, respectively. Blue and red signals correspond to DAPI nuclear staining and tissue autofluorescence, respectively. gn: gonad. in: intestine. ki: kidney. li: liver. sb: swimbladder. The vertical double arrow in (A) indicate de dorsovental axis (D: dorsal; V: ventral). The images are representative of the results observed in four fishes of each genotype. Negative controls of the juvenile gonad are shown in Figure S10 (tissue sections four to six). EXPRESSION / LABELING:
PHENOTYPE:
|
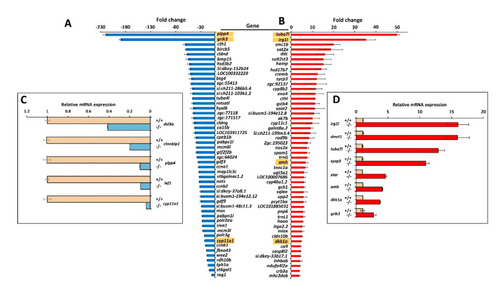
Top-50 DEGs in myoc KO male versus wild-type male zebrafish. Down- (A) and upregulated (B) genes identified by high throughput RNA sequencing with significant differences in the four comparisons (KO1 vs. WT1, KO1 vs. WT2, KO2 vs. WT1 and KO2 vs. WT2). The golden background indicates genes that were analysed by qRT-PCR. Confirmation by qRT-PCR of differential gene expression of selected down- (C) and upregulated (D) genes. |