FIGURE SUMMARY
Title

Active perception during angiogenesis: filopodia speed up Notch selection of tip cells in silico and in vivo

Authors
Zakirov, B., Charalambous, G., Thuret, R., Aspalter, I.M., Van-Vuuren, K., Mead, T., Harrington, K., Regan, E.R., Herbert, S.P., Bentley, K.
Source
Full text @ Phil. Trans. Roy. Soc. Lond., Series B

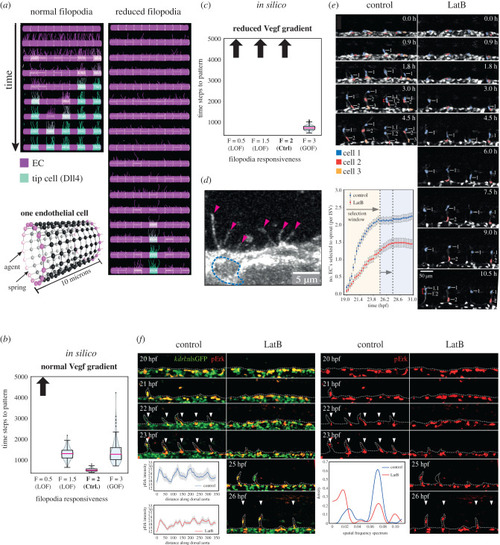
Filopodia loss-of-function (LOF) slows down Notch selection. (a) Time–space plots showing simulations of the MSM with ten cells fixed in place in a pre-existing vessel, as they detect Vegf, extend/retract filopodia and select an alternating ‘salt and pepper’ pattern of tip/stalk cells via VEGF/Notch lateral inhibition. Frames shown every 100 time steps vertically (Dll4 level high-low shown green-purple). Cutting the probability of filopodia extension (F = 0.5 ‘reduced filopodia’) slows down the collective patterning. In the simulations shown, only one tip is selected in twice the available time window compared to five with normal filopodial activity. (b,c) Violin plots showing that increasing filopodial activity (gain-of-function, GOF) speeds up patterning in silico both for normal and reduced VEGF gradient, and decreasing filopodial activity (LOF) slows down patterning. Blue shading corresponds to estimated probability density of timing values in that range. Upward arrows indicate pattern not achieved within the time window of the simulation for the corresponding parameter settings. Pink line indicates median value, black lines indicate middle quartiles, whiskers indicate upper and lower quartiles. N = 100 simulations ran for 2000 time steps. (d) A representative image of a cell in the dorsal aorta (DA), showing filopodia formation before tip cells have been selected to leave the DA into the ISV. The dotted blue line highlights the nucleus of the EC, pink arrows mark filopodia. (e) Time-lapse images of sprouting ISVs in control and latrunculin B (LatB)-treated Tg(kdrl:nlsEGFP)zf109 embryos from 19 hpf, and quantification of the number of ECs selected to sprout per ISV over time. Red brackets indicate dividing cells. Nuclei are pseudocoloured. Fewer tip cells are selected to sprout in LatB-treated embryos and the selection process is slower. Scale bar, 25 µm. N = 2 independent experiments (55 ISV tip cells were quantified from 15 embryos). (f) Lateral views of pErk immunostaining (red) in ECs (green) of WT LatB-treated Tg(kdrl:nlsEGFP)zf109 embryos at the indicated stages. Arrowheads indicate patterned pErk-positive tip cells. Tip cell patterning is delayed in LatB-treated embryos. N = 4 (one experiment shown). Left subpanel depicts quantified pErk staining as a function of distance along anterior–posterior axis, starting from the first patch of bright pErk staining for control and LatB embryos at 22 hpf. Right subpanel depicts spatial frequency spectra resulting from Lomb-Scargle analysis of quantified 22 hpf pErk stainings of control and LatB. All error bars show standard error of the mean. (Online version in colour.)

Acknowledgments
This image is the copyrighted work of the attributed author or publisher, and ZFIN has permission only to display this image to its users. Additional permissions should be obtained from the applicable author or publisher of the image. Full text @ Phil. Trans. Roy. Soc. Lond., Series B