FIGURE SUMMARY
Title

Vasohibin-1 selectively regulates secondary sprouting and lymphangiogenesis in the zebrafish trunk

Authors
Bastos de Oliveira, M., Meier, K., Jung, S., Bartels-Klein, E., Coxam, B., Geudens, I., Szymborska, A., Skoczylas, R., Fechner, I., Koltowska, K., Gerhardt, H.
Source
Full text @ Development

vash1 is highly expressed in zebrafish endothelium. (A,B) Amino acid sequence alignment using CLUSTAL O (Uniprot) of human and zebrafish Vash1 showing 65.24% sequence similarity (A), including in the indicated residues necessary for tubulin detyrosination (B). (C,D) Analysis of vash1 expression in zebrafish embryos at 24 and 48 hpf. FACS sorting and gating strategy for isolation of nEGFP+ and nEGFP− cells from Tg[fli1a:nEGFP]y7 embryos, their RNA extraction and reverse transcription leading to qPCR (C). vash1 expression, analysed by two independent primer pairs, shows a tendency towards being enriched in the endothelium of zebrafish embryos at 24 hpf (D). Data normalised to housekeeping genes. Data are mean±s.d. Each data point is an average of three technical replicates per sample, and each experiment has three biological replicates per developmental stage. n.s., not significantly different (Mann–Whitney test). (E-G) In situ hybridization of vash1 in the zebrafish embryo trunk at 24 hpf (E), 34 hpf (F) and 48 hpf (G). Arrowhead indicates where the dorsal aorta (DA) locates in the embryos. Pictures are representative of three replicated experiments. n=40 embryos for each developmental stage.

EXPRESSION / LABELING:
Gene:
Fish:
Anatomical Terms:
Stage Range: Prim-5 to High-pec

Endothelial microtubules are detyrosinated by Vash1 in zebrafish. (A,B) Knockdown (KD) strategy using a morpholino (MO) targeting the intron3-exon4 (I3-E4) (A) efficiently decreases Vash1 protein levels as detected by western blot (B). 48 hpf embryo lysate was used, three replicates were performed. (C) Mechanism of tyrosine cleavage from α-tubulin carboxy-terminus by Vash1, resulting in detyrosinated tubulin (dTyr). Detyrosination exposes a glutamate residue accessible by a custom-made antibody (Liao et al., 2019). (D-G′) Immunostainings of 48 hpf Tg[fli1ep:EGFP-DCX] embryos detect detyrosinated microtubules (referred to as dTyr; D-G) and GFP-labelled microtubules (referred as DCX; D,F). G and G′ show immunostaining of dTyr upon vash1 KD, compared with the control MO injected sibling embryos (E,E′). Arrows (E,G) indicate neural tube, with typically detyrosinated microtubules (E), reduced upon vash1 KD (G). Arrowheads indicate endothelial detyrosinated microtubules, only present in control embryos (E,E′). Asterisks (E,G) indicate motoneurons exhibiting high dTyr signal in control embryos (E,E′) and decreased dTyr signal in vash1 KD embryos (G,G′). Pictures are representative of three biological replicates. (H) Quantification of ratios between dTyr and DCX intensity signals of each ISV in control and vash1 KD groups. AU, arbitrary units. Each data point is one ISV, n=155 ISVs from 15 embryos (control) and n=205 ISVs from 12 embryos (vash1 KD), from three replicates. Data are mean±s.d. ***P<0.0002 (Mann–Whitney test). Pictures are representative of three replicated experiments.

Vash1 deficient embryos exhibit aberrant secondary sprouting. (A-F) Primary and secondary sprouting in control and vash1 KD Tg[kdr-l:ras-Cherry]s916 zebrafish embryos, with labelled blood vessels. Primary sprouting occurs from the DA at 24-30 hpf (A-C). Secondary sprouting occurs from the PCV at 34-40 hpf and ISVs form (D-F). Red arrowheads indicate secondary sprouts (E,F). Pictures are representative of three replicated experiments. (G,H) Quantification of observed frequency that either one or two different sprouts reach an ISV (G) and of number of secondary sprouts per six somites (H). n=87 ISVs from 20 embryos for vash1 KD group, and n=82 ISVs from 23 control embryos, from three biological replicates. **P<0.0021 (Mann–Whitney test). n.s., non-significant. (I,J) A transient three-way connection is formed when the secondary sprout connects with the primary ISV and lumenizes (I), after which one of its branches is resolved. The duration of three-way connections from lumenization to resolution was quantified in control and vash1 MO-injected embryos (J). Data points represent 45 ISVs from 34 embryos for vash1 KD and 39 ISVs from 30 embryos for control groups, from four biological replicates. **P<0.0021 (Kolmogorov–Smirnov test). Data are median±s.d. (G) and mean±s.d. (H,J).

Secondary sprouts in vash1 morphants exhibit more Prox1+ cells and higher proliferation rates. (A,B) Secondary sprouts in Tg[kdr-l:ras-Cherrys916,fli1a:nEGFPy7] embryos, with membrane- and nuclei-labelled endothelial cells (EC) in control (A) and vash1 KD embryos (B). White arrowheads indicate nuclei in secondary sprouts (outlined by dashed line). (C,D) Quantification of the number of endothelial nEGFP-labelled nuclei in secondary sprouts immediately before connection to the ISV (C), and cell division frequency in the secondary sprout before and after connecting to the ISV, from 30 to 70 hpf (D). Quantifications are from three biological replicates. **P<0.0021, ****P<0.0002 (Mann–Whitney test in C, t-test in D). (E,F) Prox1-positive (Prox1+ve) EC were identified by immunostaining in Tg[fli1a:nEGFPy7] embryos in control and vash1 morphants. In controls, migrating cells in secondary sprouts are Prox1+ve and their neighbouring EC in the PCV are Prox1-negative (E). In vash1 morphants, both EC in the secondary sprout and the neighbouring EC still in the PCV are Prox1+ve (F). Analysed EC are highlighted (dashed line), and neighbouring EC are connected with a line. (G) Quantification of incidence of nEGFP+ Prox1+ve neighbouring EC per seven somites per embryo in both control and vash1 MO-injected embryos. **P<0.0021 (Mann–Whitney test). Pictures are representative of three replicated experiments.

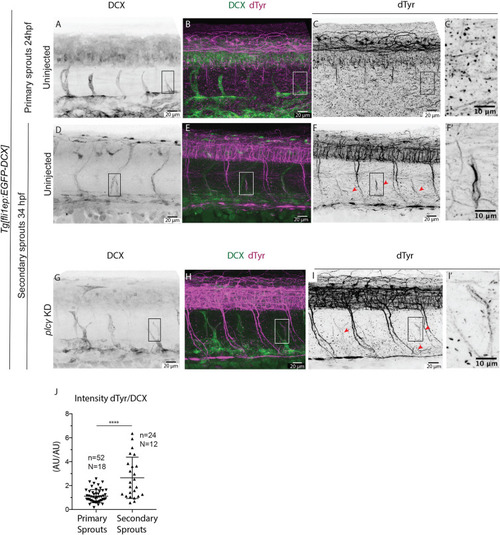
Microtubules of secondary sprouts are selectively detyrosinated. (A-I′) Immunostainings using antibody detecting the glutamate amino acid of detyrosinated microtubules (dTyr) during primary (A-C) and secondary (D-I) sprouting in uninjected (A-F) and plcγ KD (G-I) Tg[fli1ep:EGFP-DCX] embryos, labelling all endothelial microtubules (DCX). C′,F′ and I′ are magnifications from boxed region in C,F,I, respectively. plcγ KD embryos (G-I′) show reduced primary sprouting, facilitating the visualization and quantification of dTyr signal specifically in secondary sprouts. Arrowheads indicate secondary sprouts. (J) Quantification of the dTyr/DCX signal intensities in primary sprouts of control MO-injected embryos, and secondary sprouts from plcγ MO-injected embryos. n=52 control primary sprouts from 18 embryos, n=24 plcγ KD secondary sprouts from 12 embryos, from one experiment. ****<0.00001 (Mann–Whitney test). Pictures are representative of 3 replicated experiments.

Vash1 regulates formation of trunk lymphatic vasculature. (A,B) Tg[fli1a:EGFP]y1 labels parachordal lymphangioblasts (PL, indicated by asterisks) of control (A) and vash1 KD embryos (B) at 52 hpf. (C) Quantification of the percentage of somites with PLs in embryos injected with control and vash1 MO, as well as the rescue with 150 pg vash1 mRNA. Each point corresponds to one embryo. (D) Quantification of percentage of PLs connected to a venous ISV in embryos injected with control and vash1 MO; 6-8 somites. In C, n=62 for controls, n=62 for vash1 morphants and n=59 for vash1 morpholino and RNA-injected embryos. In D, n=25 for controls and n=23 for vash1 morphants. Three biological replicates were carried out. *P<0.0332, **P<0.02, ****P<0.0001 (Kruskal–Wallis in C, Mann–Whitney test in D). (E-G) Zebrafish trunk of 4 dpf Tg[kdr-l:ras-Cherrys916,fli1a:EGFPy1] zebrafish embryos. Arrowheads indicate GFP- and mCherry-positive putative ISV-to-ISV connections in vash1 KD embryos (F, ISV-to-ISV connection in F′). The main axial lymphatic in the zebrafish trunk – the thoracic duct (TD) – is GFP-positive, mCherry-negative (E,E′, arrow), and absent in the vash1 KD embryo (F, ISV-to-ISV connection in F″). The percentage of somites with TD was quantified (G). n=60 control and n=63 morphants analysed. ****P<0.0001 (Mann–Whitney test). (H) Strategy for CRISPR mutation of exon 4 of vash1 includes design of a duplex guide RNA (dgRNA) to target the codons that translate into lysine and cystein (in bold) of positions 174 and 175 of the zebrafish Vash1 protein, crucial for the carboxypeptidase function. (I,J) Trunk region of Crispr/Cas injected vash1 knockout (KO) Tg[fli1a:EGFP]y1 embryos (J) in comparison with the control (I). Embryos injected with control gRNA and Cas9 exhibit regular PL coverage (I, asterisks) and no mutation. vash1 CRISPants – embryos with confirmed CRISPR mutations – lack PLs (J). n=30 control embryos, n=14 CRISPants.

Model of Vash1 function in zebrafish trunk. (A-F) Microtubule detyrosination is catalysed by Vash1 (A), particularly occurring in secondary sprouts (B). In the secondary sprouts, Vash1-mediated detyrosinated microtubules keep control of the number of sprouting cells, cell proliferation and cell protrusion formation to avoid over-sprouting (C). Secondary sprouts with correctly detyrosinated microtubules form PLs at 2 dpf, which in turn form the TD at 3-4 dpf (C). Upon vash1 KD, microtubules of secondary sprouts are no longer detyrosinated (D,E). Cells of secondary sprouts over-proliferate, fail to form PLs and a functional TD, although PLs forming from veins still occur (F).

ZFIN is incorporating published figure images and captions as part of an ongoing project. Figures from some publications have not yet been curated, or are not available for display because of copyright restrictions.

EXPRESSION / LABELING:
Antibody:
Fish:
Knockdown Reagents:
Anatomical Term:
Stage: Long-pec
PHENOTYPE:
Fish:
Knockdown Reagents:
Observed In:
Stage: Long-pec
Acknowledgments
This image is the copyrighted work of the attributed author or publisher, and ZFIN has permission only to display this image to its users. Additional permissions should be obtained from the applicable author or publisher of the image. Full text @ Development