
- Title
-
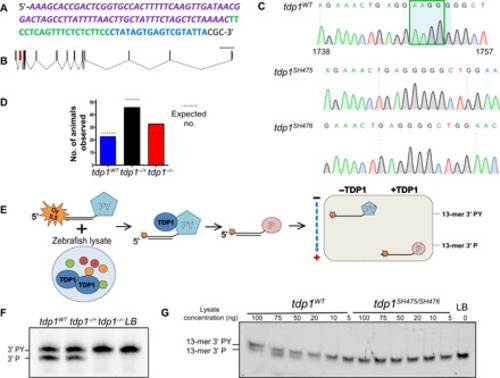
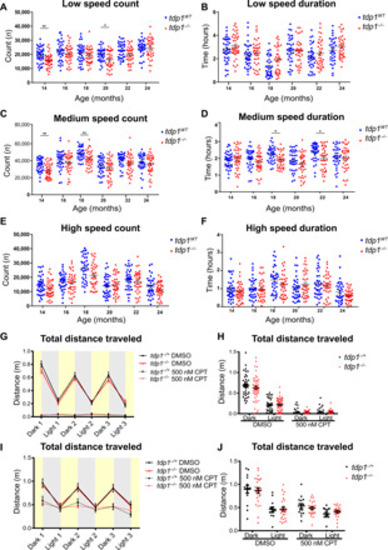
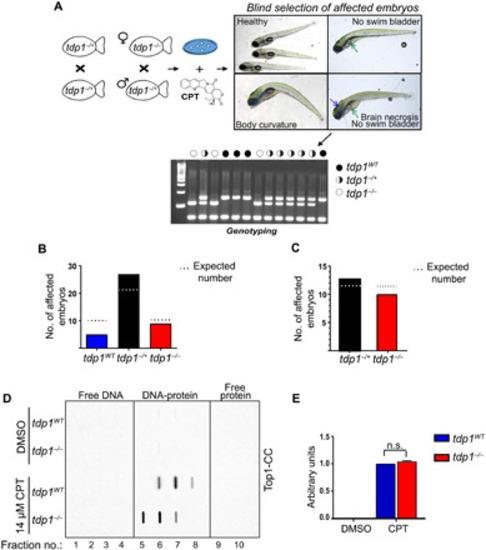
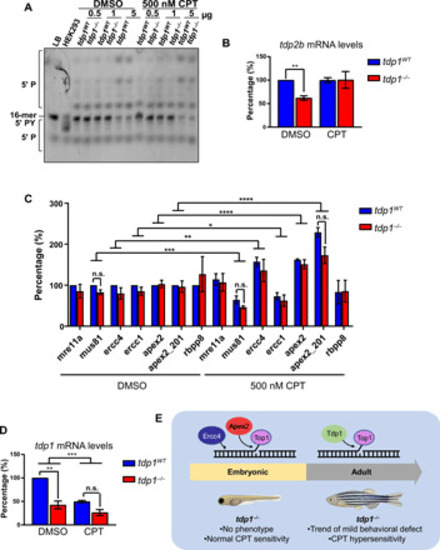
Tdp1 protects from topoisomerase 1-mediated chromosomal breaks in adult zebrafish but is dispensable during larval development
- Authors
- Zaksauskaite, R., Thomas, R.C., van Eeden, F., El-Khamisy, S.F.
- Source
- Full text @ Sci Adv
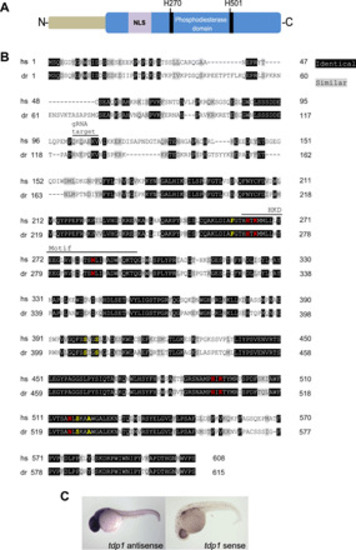
( EXPRESSION / LABELING:
|
( |
( |
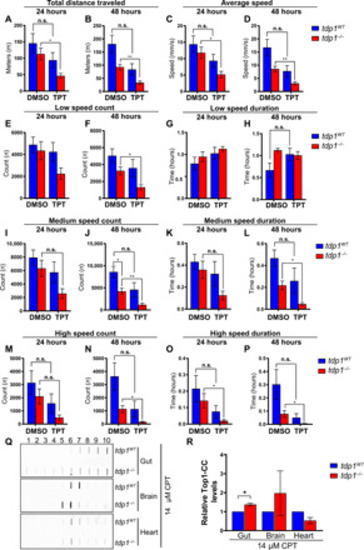
( PHENOTYPE:
|
( PHENOTYPE:
|
( |