FIGURE SUMMARY
Title

Calcium Imaging and the Curse of Negativity

Authors
Vanwalleghem, G., Constantin, L., Scott, E.K.
Source
Full text @ Front. Neural Circuits

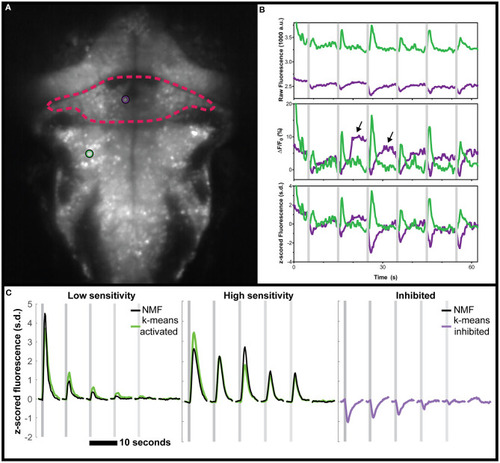
Negative deviations from baseline in real data from the cerebellum of zebrafish, and performance of various analysis tools. (A) Mean fluorescence image of a 6 dpf zebrafish expressing nuclear-targeted GCaMP6s (Chen et al., 2013). The cerebellum is outlined in red, and an inhibited neuron is indicated with a magenta circle. The green circle indicates an activated neuron in the hindbrain. (B) Time traces of the raw (top), ΔF/F0 (middle), or z-scored (bottom) fluorescence for these two neurons, in their respective colors. Arrows indicate positive deviation artifacts resulting from the cessation of inhibition on the inhibited neuron. (C) Comparisons between the clusters identified using k-means (green for activated, magenta for inhibited) and those identified with NMF (black). No inhibited cluster was identified by NMF. Gray shaded areas indicate the time of vestibular stimulation (Favre-Bulle et al., 2018), with a progression from strong to weak stimuli across the stimulus train.

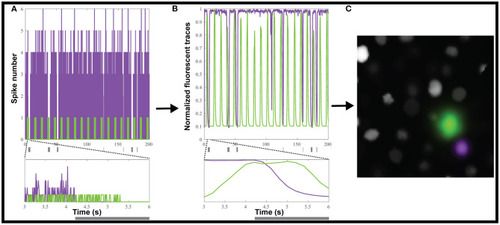
Creating simulated calcium imaging datasets. (A) An example dataset of simulated activity, showing spike numbers for one neuron (green) activated and one (magenta) inhibited by a hypothetical stimulus (gray rectangles). (B) The spike trains are convolved with a GCaMP6f kernel and noise to generate fluorescence traces. (C) The simulated neuronal activity was used to create an artificial movie as captured by a microscope.

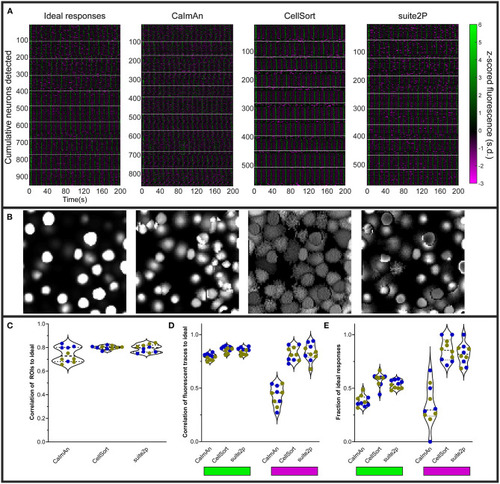
Various analyses' performances on simulated data. (A) Raster plots of ideal responses from NAOMi, and extracted fluorescence traces from CaImAn, CellSort, and suite2p. All the fluorescent traces were z-scored from−3 to 6 s.d. White horizontal lines separate the individual datasets. (B) Segmentation of the regions of interest (ROIs) by each algorithm, as for the raster plots in (A), for one representative dataset. (C) Quantification of the correlation between the ROIs identified by each of the three algorithms and the ideal ROIs. Symbol color indicate the percentage of inhibited neurons (n = 5 datasets with 10% inhibited neurons in blue, and n = 5 datasets with 20% inhibited neurons in yellow). (D) Average maximum correlations between the traces identified by each algorithm and the ideal responses for the activated neurons (left, green rectangle) and the inhibited neurons (right, magenta rectangle). (E) Fraction of the ideal responses identified with a correlation above 0.5 by the three algorithms for the activated neurons (left) and the inhibited neurons (right).

Acknowledgments
This image is the copyrighted work of the attributed author or publisher, and ZFIN has permission only to display this image to its users. Additional permissions should be obtained from the applicable author or publisher of the image. Full text @ Front. Neural Circuits