FIGURE SUMMARY
Title

MITO-Luc/GFP zebrafish model to assess spatial and temporal evolution of cell proliferation in vivo

Authors
de Latouliere, L., Manni, I., Ferrari, L., Pisati, F., Totaro, M.G., Gurtner, A., Marra, E., Pacello, L., Pozzoli, O., Aurisicchio, L., Capogrossi, M.C., Deflorian, G., Piaggio, G.
Source
Full text @ Sci. Rep.

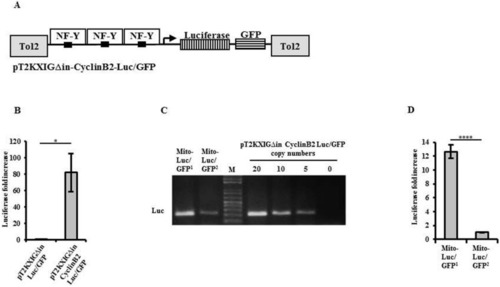
Establishing Tg (cyclin B2:Luc/GFP) MITO-Luc/GFP transgenic zebrafish lines. (A) Schematic representation of the pT2KXIGΔin-cyclin B2-Luc/GFP expression vector. A fragment of murine cyclin B2 promoter containing CCAAT boxes (black) was cloned upstream of the firefly luciferase gene (vertical stripes) and the green fluorescent protein GFP (horizontal stripes), in the pT2KXIGΔin plasmid containing the Tol 2 transposable element (gray). The binding of NF-Y to the CCAT boxes is shown. (B) Relative luciferase activity obtained in one to four-cell stage AB embryos transiently injected with the pT2KXIGΔin-Luc/GFP or the pT2KXIGΔin-cyclin B2-Luc/GFP. The error bars are mean standard deviations from two experiments performed in duplicate. Asterisks denote significant differences between pT2KXIGΔin-cyclin B2-Luc/GFP and empty vector assessed by t-test (*p < 0.05). (C) Quantification of transgene copy number in MITO-Luc/GFP zebrafish lines by quantitative PCR. Amplification of 10/15 transgene copies from MITO-Luc/GFP1 and 1 from MITO-Luc/GFP2 genomic DNA, is quantified by comparing amplifications from known pT2KXIGΔin-cyclin B2-Luc/GFP copy numbers. Full-length gel is presented in Supplementary Figure S17. (D) Relative luciferase activity in MITO-Luc/GFP1 and MITO-Luc/GFP2 zebrafish lines. The error bars are mean standard deviations from two experiments performed at least in triplicate with 3 embryos in each group. Asterisks denote significant differences between MITO-Luc/GFP1 and MITO-Luc/GFP2 embryos assessed by t-test (****p < 0.0001).

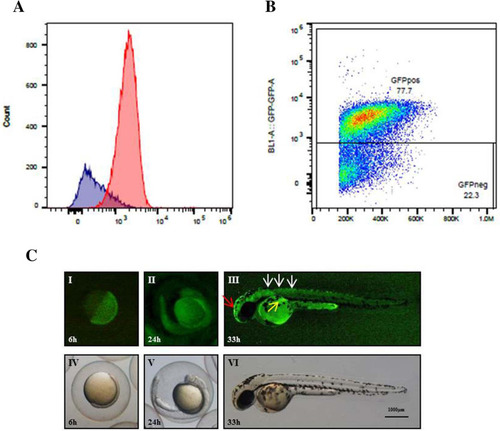
Fluorescence correlates with proliferation in MITO-Luc/GFP zebrafish line. (A) Flow cytometry analysis of cells dissociated from 200 zebrafish MITO-Luc/GFP 40 hpf embryos, previously incubated for 3 h with BrdU. Fixed cells were stained with anti-BrdU and anti-GFP antibodies. Histogram plot represents different BrdU accumulation in GFP positive (red) and negative (blue) cells. (B) GFP positive and GFP negative cells gating strategy. (C) GFP signal in 6 (I), 24 (II) and 33 hpf (III) embryos. GFP expression is almost ubiquitous throughout 6 and 24 hpf embryos (I,II). It is tissue specific in 33 hpf embryos being accumulated in the head (III, red arrow), proximal trunk (III, white arrows) and in developing fin (III, yellow arrow). Bright light images are shown (IV,V,VI).

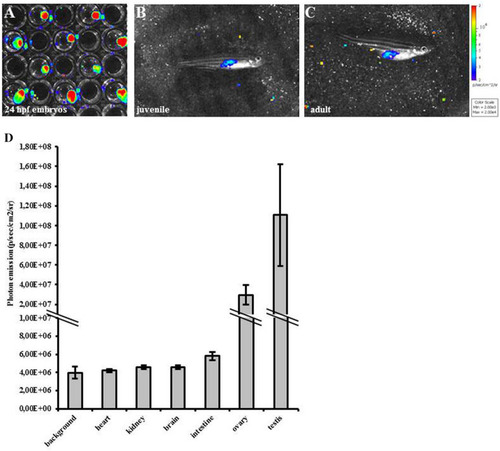
Bioluminescence correlates with proliferation in MITO-Luc/GFP zebrafish line. (A–C) In vivo BLI of representative MITO-Luc/GFP1 zebrafish embryos (1 embryo for each well) (A), juvenile (B) and adult (C) stages. Light emitted from the animal appears in pseudocolor scaling. (D) Photon emission quantification of organs extracted from adult zebrafish. The error bars are mean standard deviations from six samples for each organ.

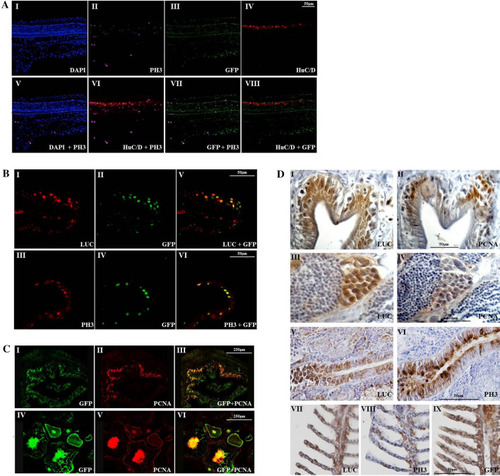
Proliferation markers colocalize with GFP and luciferase proteins in MITO-Luc/GFP zebrafish tissues. (A) Immunofluorescence analysis of DAPI (I), pH3 (II), GFP (III), HuC/D(IV), DAPI-pH3 merge (V), pH3-HuC/D merge (VI), pH3-GFP merge (VII) and GFP-HuC/D merge (VIII) in the trunk region of 24 hpf whole-mount transgenic embryos. (B) Immunofluorescence analysis of luciferase (I), GFP (II, IV), pH3 (III), luciferase-GFP merge (V) and pH3-GFP merge (IV) in adult epidermal tissue. (C) Immunofluorescence analysis of GFP (I,IV), PCNA (II,V), GFP-PCNA merge (III,VI), in intestine (I,II,III) and ovary (IV,V,VI). (D) Immunohistochemical analysis of luciferase (I, III, V, VII), PCNA (II, IV), pH3 (VI, VIII) and GFP (IX) in adult intestine (I, II), testes (III, IV), kidney (V, VI) and gills (VII, VIII, IX). In all tissue analyzed, cells expressing proliferation markers, either PCNA or pH3, show immunoreactivity for luciferase and/or GFP.

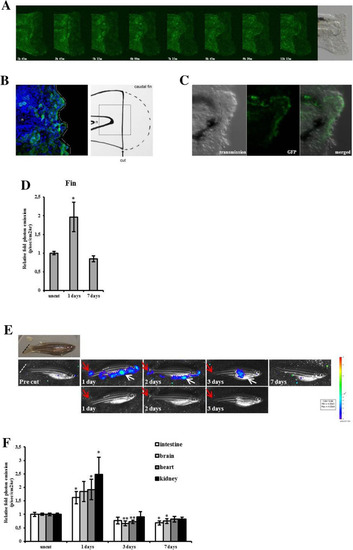
Caudal fin regeneration in MITO-Luc/GFP zebrafish. (A) Summary frame pictures of GFP during caudal fin regeneration in a 3 dpf embryo. The tridimensional images are the results of a merge of nine different layers acquisition (Z-stack). The dynamic of blastoma growth is clearly visible. Bright light image of the fin is shown in the last picture. (B) Immunofluorescence analysis of GFP-DAPI merge 1 day after fin clip in a 3 dpf embryo. The recruitment of GFP positive cells on the marginal edge is visible. Schematic representation of fin clip is shown. Notocord (n) is shown as anatomical reference. (C) Confocal imaging of GFP positive cells during regeneration of the caudal fin in a MITO-Luc/GFP2 2 dpf live embryo. Dotted line in the left image indicates the amputation site, made 24 h before the acquisition. (D) Relative quantification of fin from adult zebrafish after fin clip. Luciferase activity was measured at 1 and 7 days after fin clip. Uncut fins were used as control. The error bars are mean standard deviations from six samples for each group. Asterisks denote significant differences between control and treated groups assessed by t-test (*p < 0.05). (E) BLI of representative MITO-Luc/GFP1 zebrafish longitudinal analysis (pre-cut, 1 day, 2 days, 3 days and 7 days) after fin clip procedure. Red arrows indicate light coming from regenerating caudal fin. White arrows indicate light coming from the abdominal organs. A bright picture and images without luminescence signal are shown for 1, 2 and 3 days as anatomical references. Light emitted from the animals appears in pseudocolor scaling. (F) Ex vivo BLI of zebrafish organs after fin clip. Relative fold induction of photon emission is presented. Luciferase activity was measured in dissected organs from zebrafish sacrificed 1, 3, and 7 days after fin clip. Uncut zebrafish were used as control group. The error bars are mean standard deviations from six fishes for each group. Asterisks denote significant differences between control and treated groups assessed by t-test (*p < 0.05, **p < 0.01).

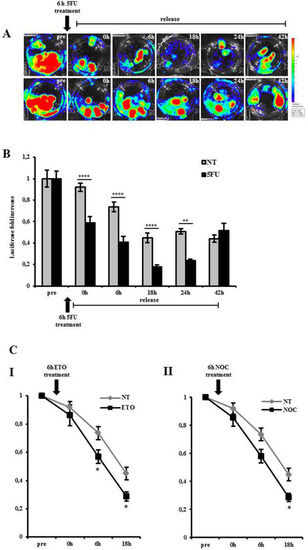
Inhibition of luciferase in zebrafish embryos upon antiproliferative treatments. (A) BLI of a pool of 10 MITO-Luc/GFP embryos before treatment (pre). The embryos have been treated with a pulse of 100 mM 5FU for 6 h as indicated. Upon 5FU washout and replacement with fresh water BLI was measured at time 0, 6, 18, 24 and 42 h. Bottom panel represent untreated control group imaged at the same time points. (B) Relative luciferase activity of a pool of 10 MITO-Luc/GFP embryo extracts collected before treatment. The embryos were treated with a pulse of 100 mM 5FU as indicated. Following 5FU washout and replacement with fresh water embryo extracts were collected at time 0, 6, 18, 24 and 42 h. Gray bars represent untreated control pool extracts collected at the same time points. The error bars are mean standard deviations from three experiments performed in triplicate. Asterisks denote significant differences between control and treated groups assessed by t-test (***p < 0.001****p < 0.0001). (C) Relative luciferase activity of a pool of 10 MITO-Luc/GFP embryo extracts. The embryos were treated with a pulse of 20 mM Etoposide (I) and 150 nM Nocodazole (II) for 6 h as indicated. Upon drug removal and replacement with fresh water embryo extracts were collected at time 0, 6, 18 h. Gray lines represent untreated control pool extracts collected at the same time points. The error bars are mean standard deviations from three experiments. Asterisks denote significant differences between control and treated groups assessed by t-test (*p < 0.05).

Acknowledgments
This image is the copyrighted work of the attributed author or publisher, and ZFIN has permission only to display this image to its users. Additional permissions should be obtained from the applicable author or publisher of the image. Full text @ Sci. Rep.